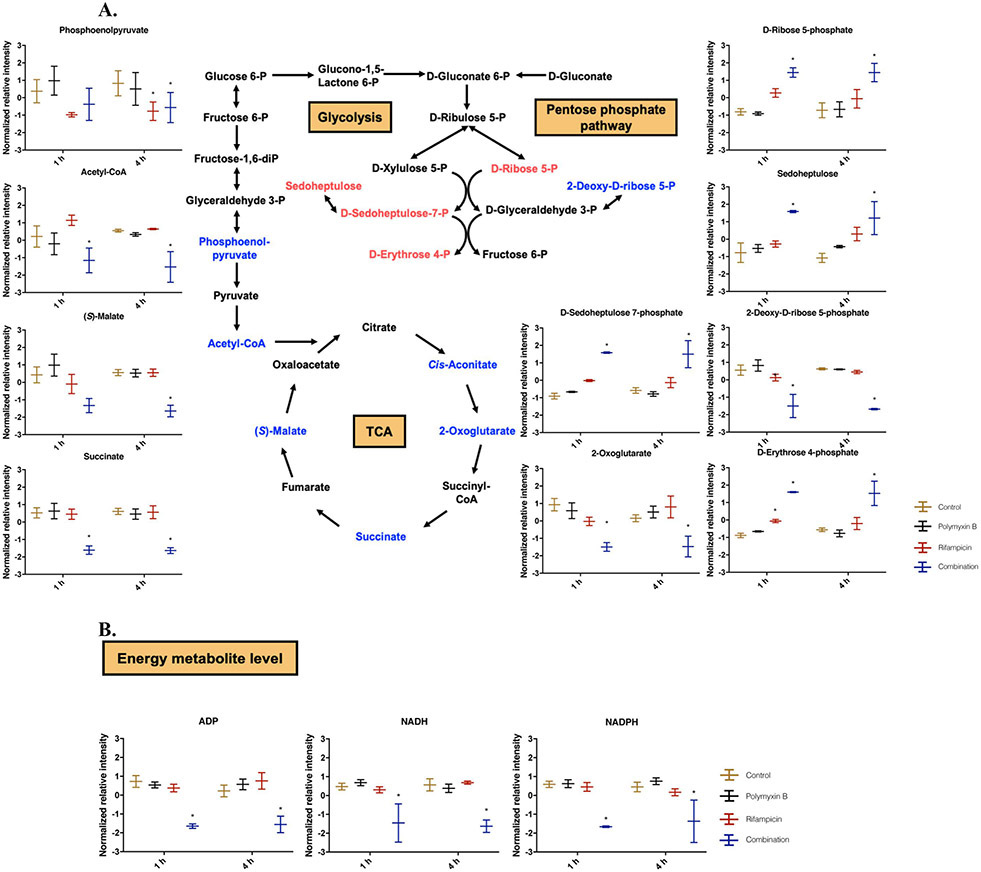
Figure 6. Perturbations of central carbon metabolism in A. baumannii AB5075 treated with polymyxin B alone, rifampicin alone and the combination at 1 and 4 h.
(A) Schematic diagram and box plots show the significantly perturbed intermediates of PPP, glycolysis and TCA cycle in A. baumannii AB5075. Significantly perturbed metabolites (log2FC ≤ −1 or ≥ 1 and FDR < 0.05) are colored blue (decrease) or red (increase) in the schematic diagram and marked with * in box plot. (B) Box plots for the main depleted energy metabolites in A. baumannii AB5075 in the groups of control (yellow), polymyxin B (black), rifampicin (red) and the combination (blue). Significantly perturbed metabolites (log2FC ≤ −1 or ≥ 1 and FDR < 0.05) are marked with *.

