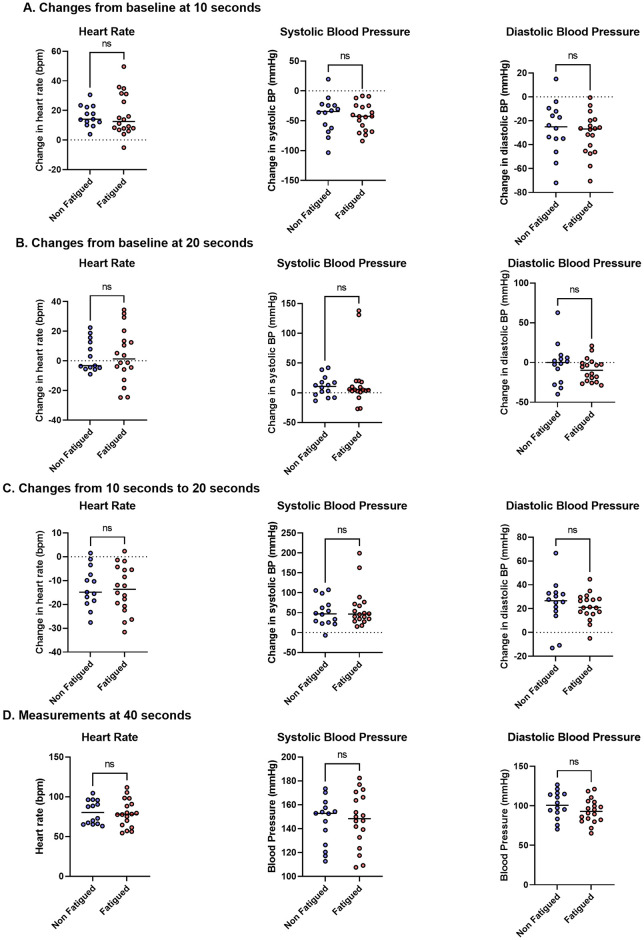
Fig 3. Change in heart rate and blood pressure following an active stand.
Changes from baseline measurements in heart rate, systolic blood pressure and diastolic blood pressure shown at (A) 10 seconds and (B) 20 seconds. Rate of change from 10 seconds to 20 seconds in heart rate and blood pressure are shown in (C). Results at 40 seconds are shown in (D). T-tests and Wilcoxon rank-sum tests used to assess between-group differences. ns = not significant.

