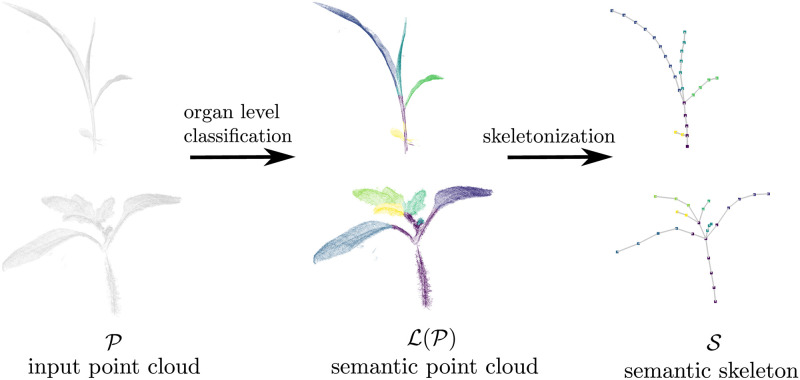
Fig 2. Extracting skeletal structure for using semantics of the plant.
The figure illustrates the skeletonization pipeline for a maize (top) and tomato (bottom) plant scan. Note that for the tomato plant, we classify individual leaflets (green + yellow + light-blue) as separate instances rather than as an individual leaf. The leaflets can be combined into a single leaf in case this distinction is not desired/required for the application.

