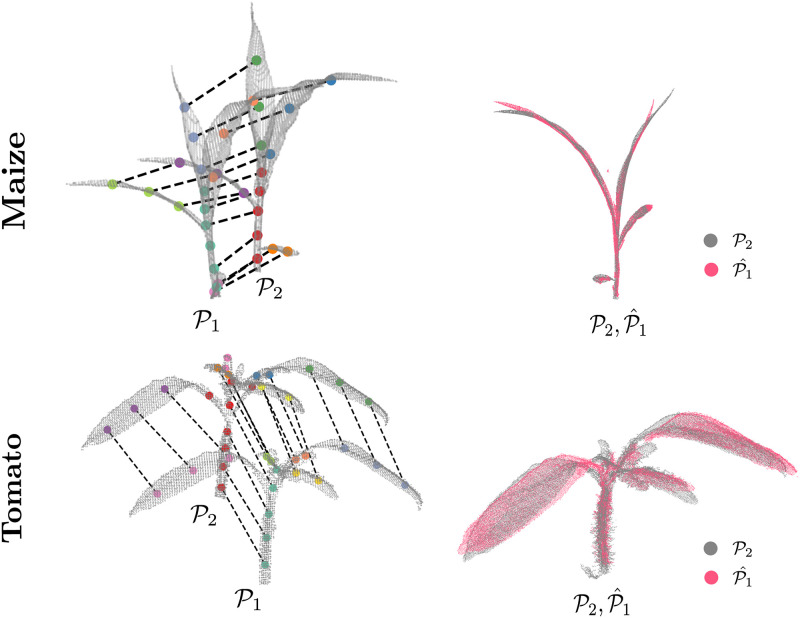
Fig 7. 4D registration of a point cloud pair scanned on consecutive days for maize (top) and tomato (bottom) plant.
The left column shows the two input point clouds () along with their skeletons, with the estimated correspondences between the skeleton nodes shown by dashed lines, and the right column shows the deformed point cloud (in pink) overlaid on .

