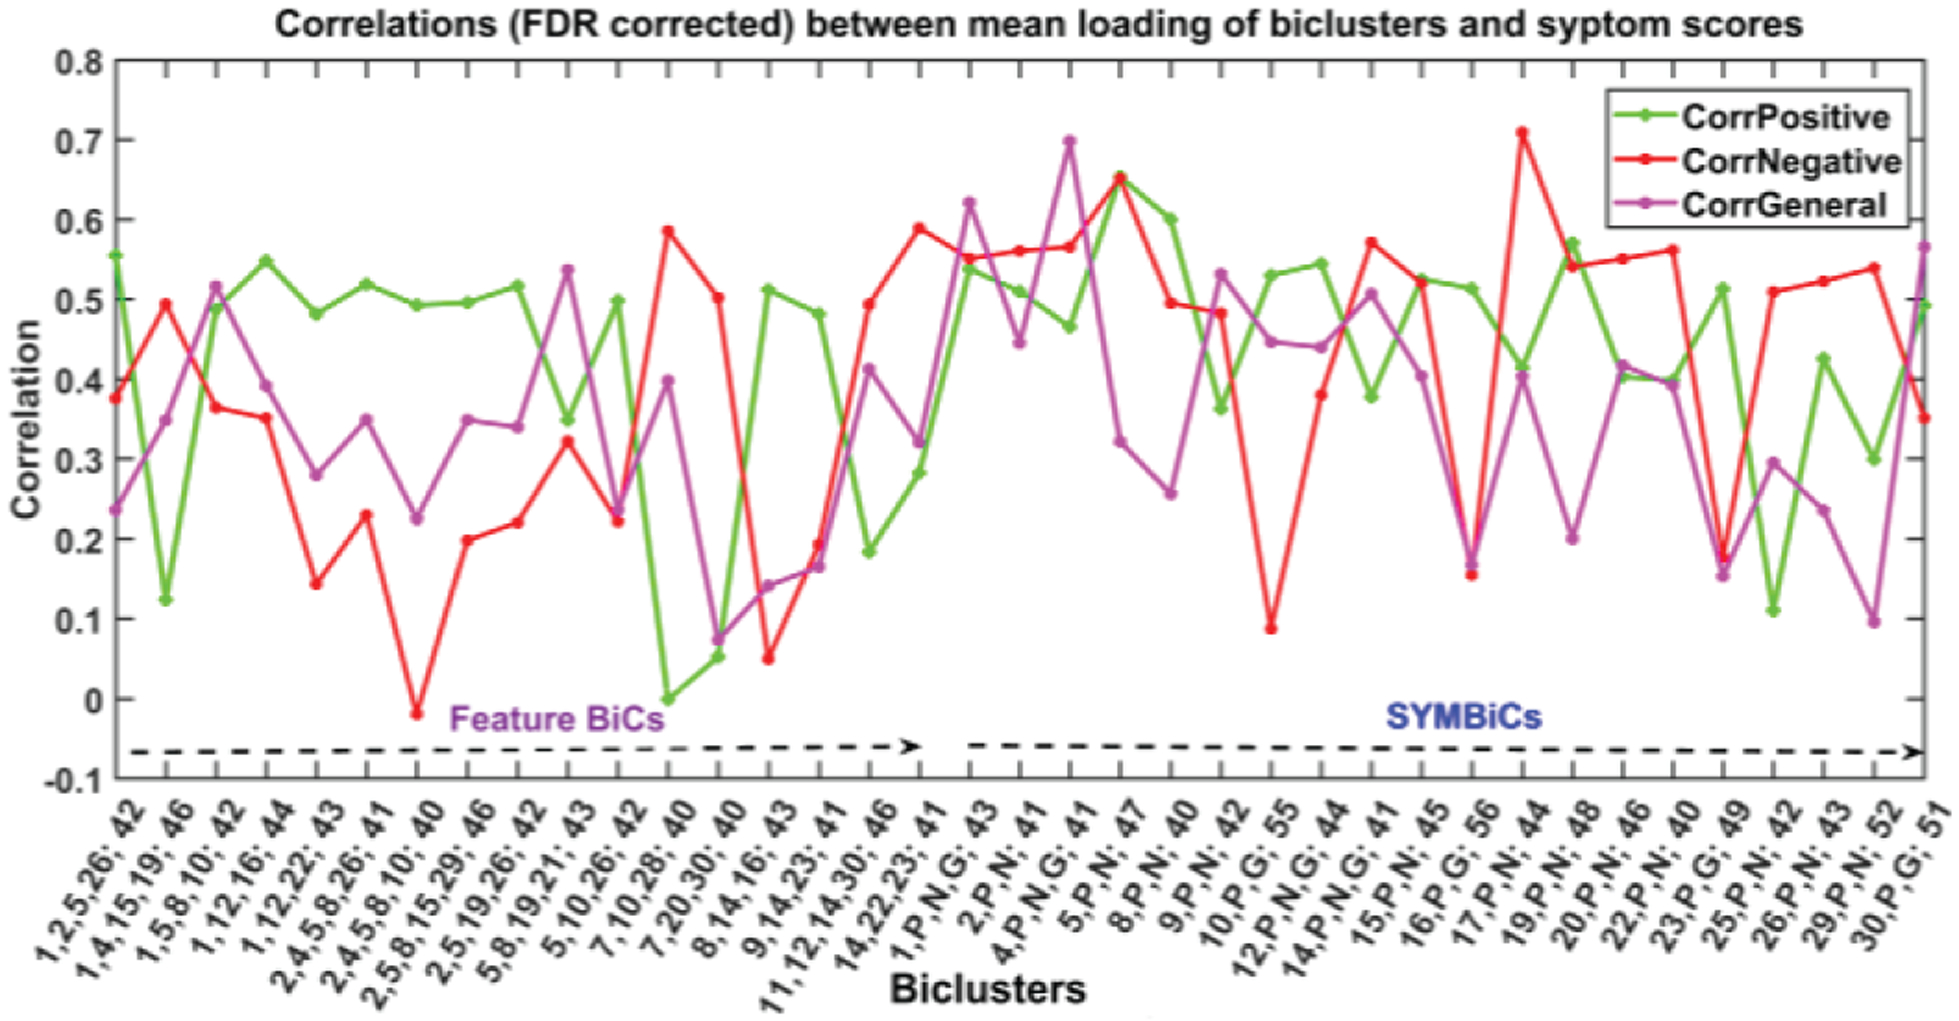
Fig. 10.

The figure demonstrates results for an extended run of N-BiC for all 30 components and three symptom scores. The biclusters are significantly correlated with (at least one) symptom score (≥ 0.05, FDR corrected). It reports 34 BiCs from a vast set of more than a thousand biclusters primarily collected for an input parameter setup (minComp = 3, minSub = 40, overlap = 20 %). The BiCs are divided into two subgroups feature BiCs and SYMBiCs. Feature BiCs include only SBM components and SYMBiCs consist of three symptom scores and 1 – 2 SBM components. The numbers in xticklabel represent components and subjects included in the corresponding bicluster. (The number before the semicolon and separated by commas stands for components and the number after the semicolon represents the number of subjects included in that bicluster.) Here, P, N, and G stand for positive, negative, and general symptom scores respectively.
