
Fig. 8.
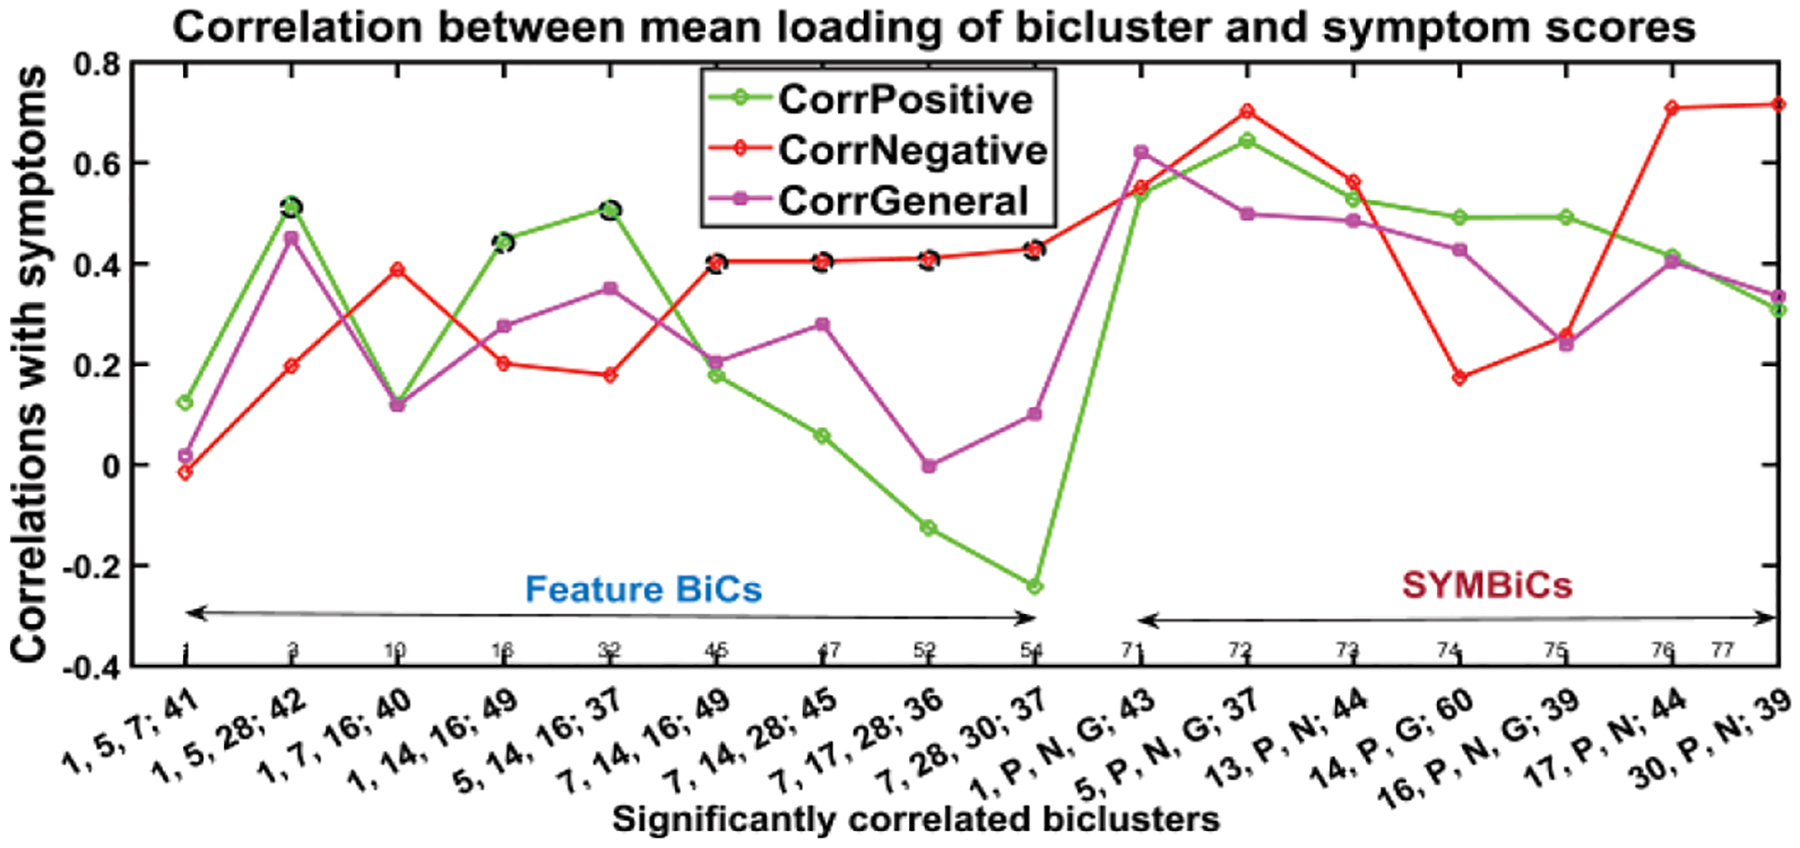
Biclusters significantly correlated with (at least one) symptom score (p-value ≤ 0.05). Included are the biclusters, which have tall spikes in figure 7, and classified the BiCs into two subgroups feature BiCs and SYMBiCs Feature BiCs that include only SBM components and SYMBiCs consist of three symptom scores and 1or 2 SBM components. Significant positive correlations are denoted by black circles; significant negatives are blue circles and the significant SYMBiCs are represented by ellipsoids. (Numbers in x-axis represent components and subjects within that bicluster. The number before the semicolon and separated by commas stand for components and the number after the semicolon represents the number of subjects included in that bicluster.)