
Figure 1: DNA content histogram and genomic profile of flow sorted ASCP biopsy.
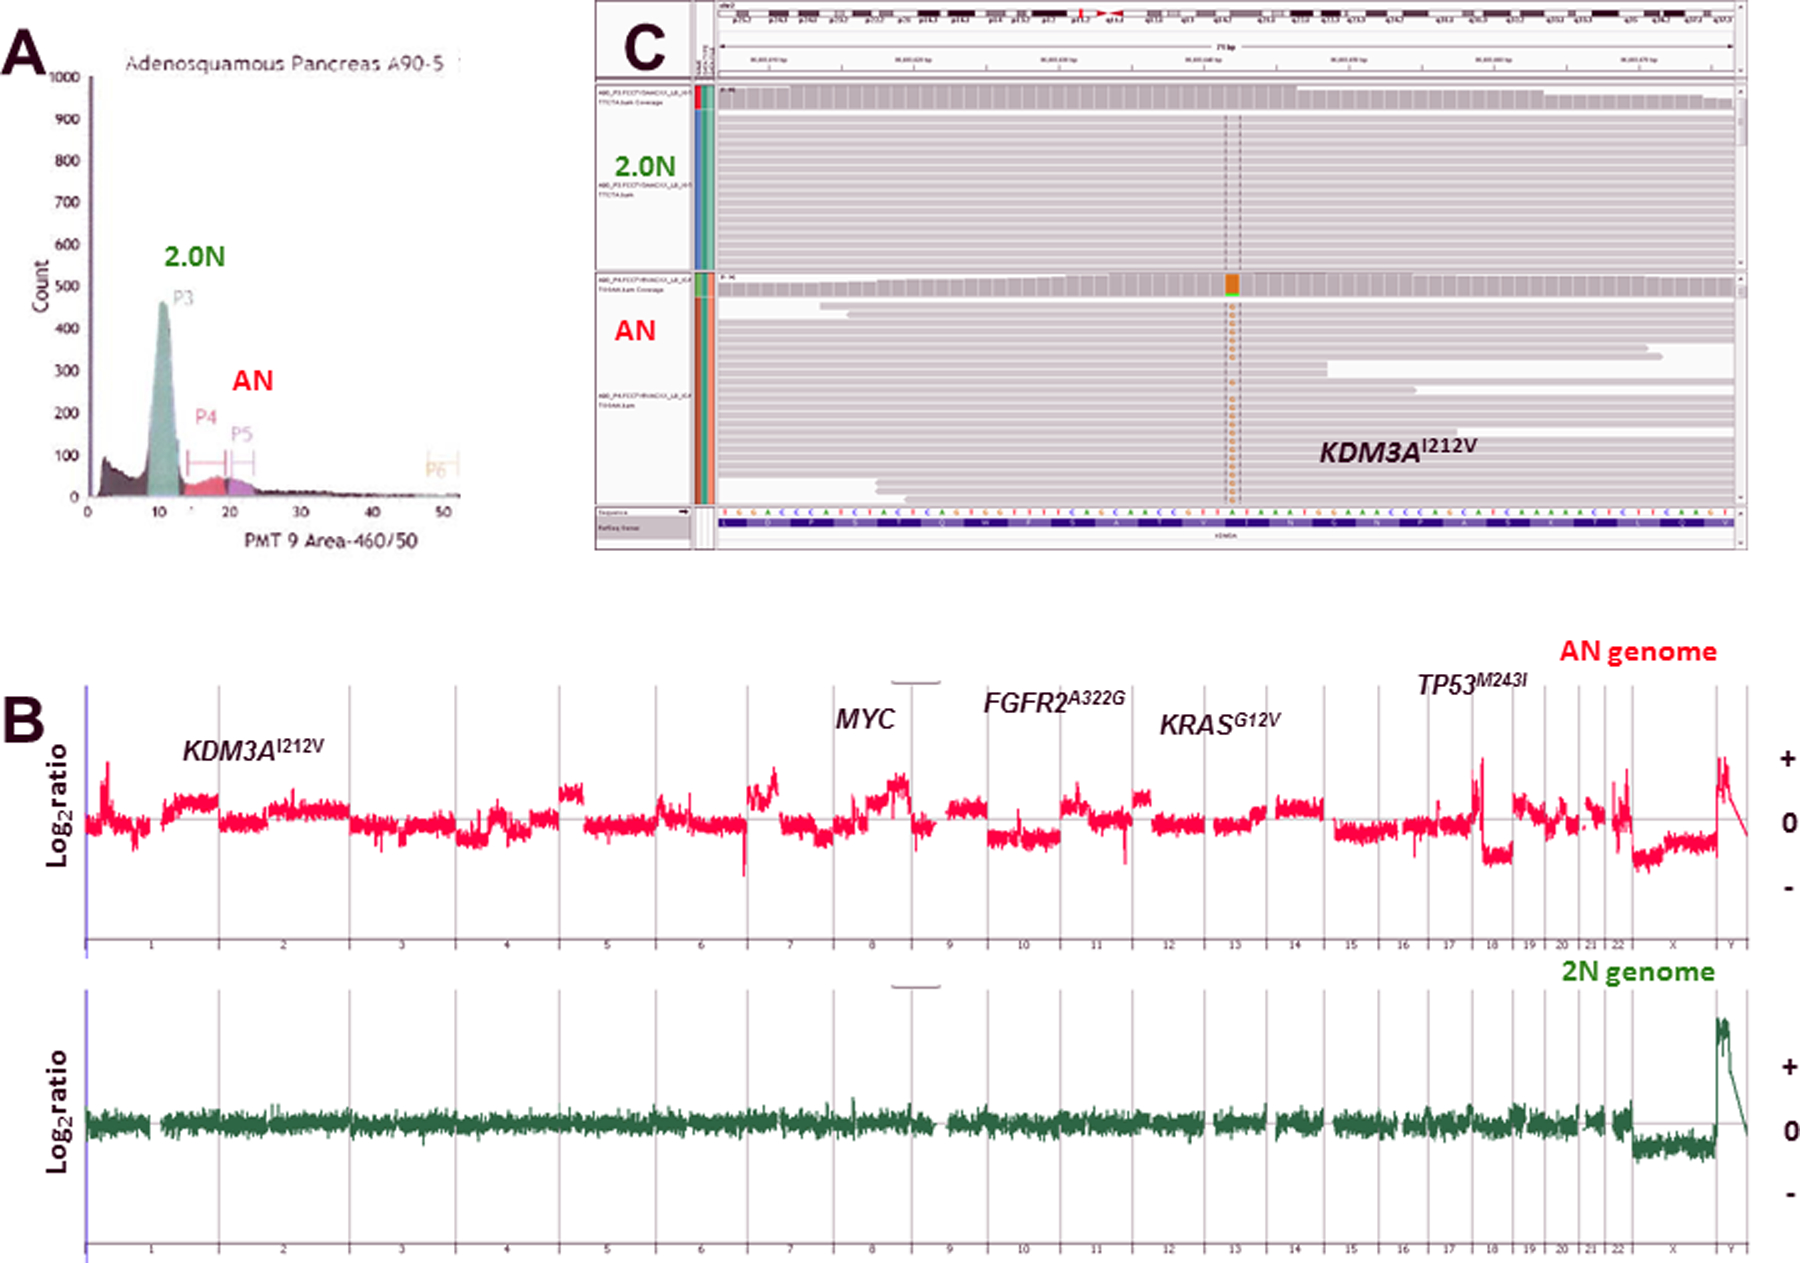
A) Diploid (2N) and aneuploid peaks were identified and sorted from FFPE tissue sample A90. B–C) CNV and mutation profiles of the normal 2N and tumor aneuploid populations. The X and Y axes in the CGH plots represent chromosome and log2 ratios for each genome.