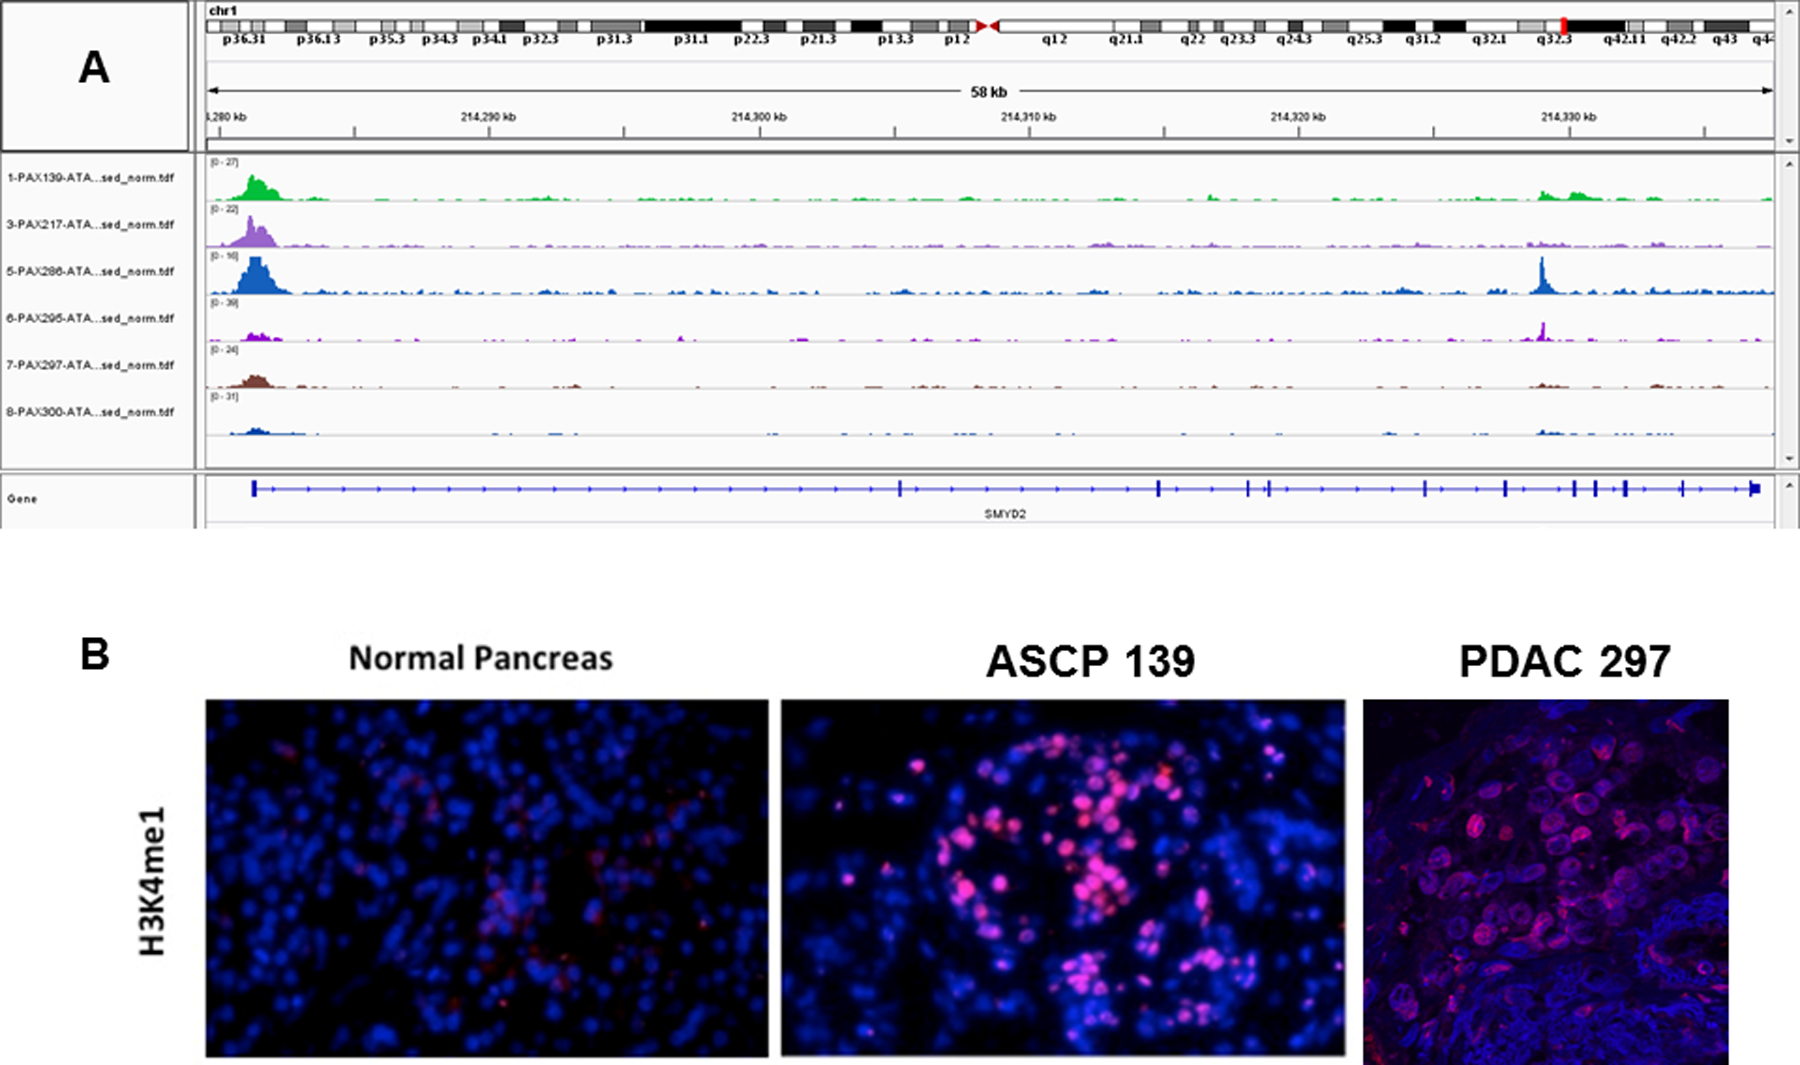
Figure 4: ATAC-seq profile of SMYD2 and active chromatin mark in ASCP PDX models.

A) IGV views of chromatin accessibility in ASCP (top 3 rows) and PDAC (bottom 3 rows) PDX models. All samples were flow sorted prior to ATAC-seq analysis. B) Immunofluorescence analysis (40x magnification) of H3K4me expression in normal pancreas and tumor tissue (PAX 139).
