
Figure 1: Range of predicted state-level African American-white difference in years of schooling and cognitive outcomes by Census region and study samplee.
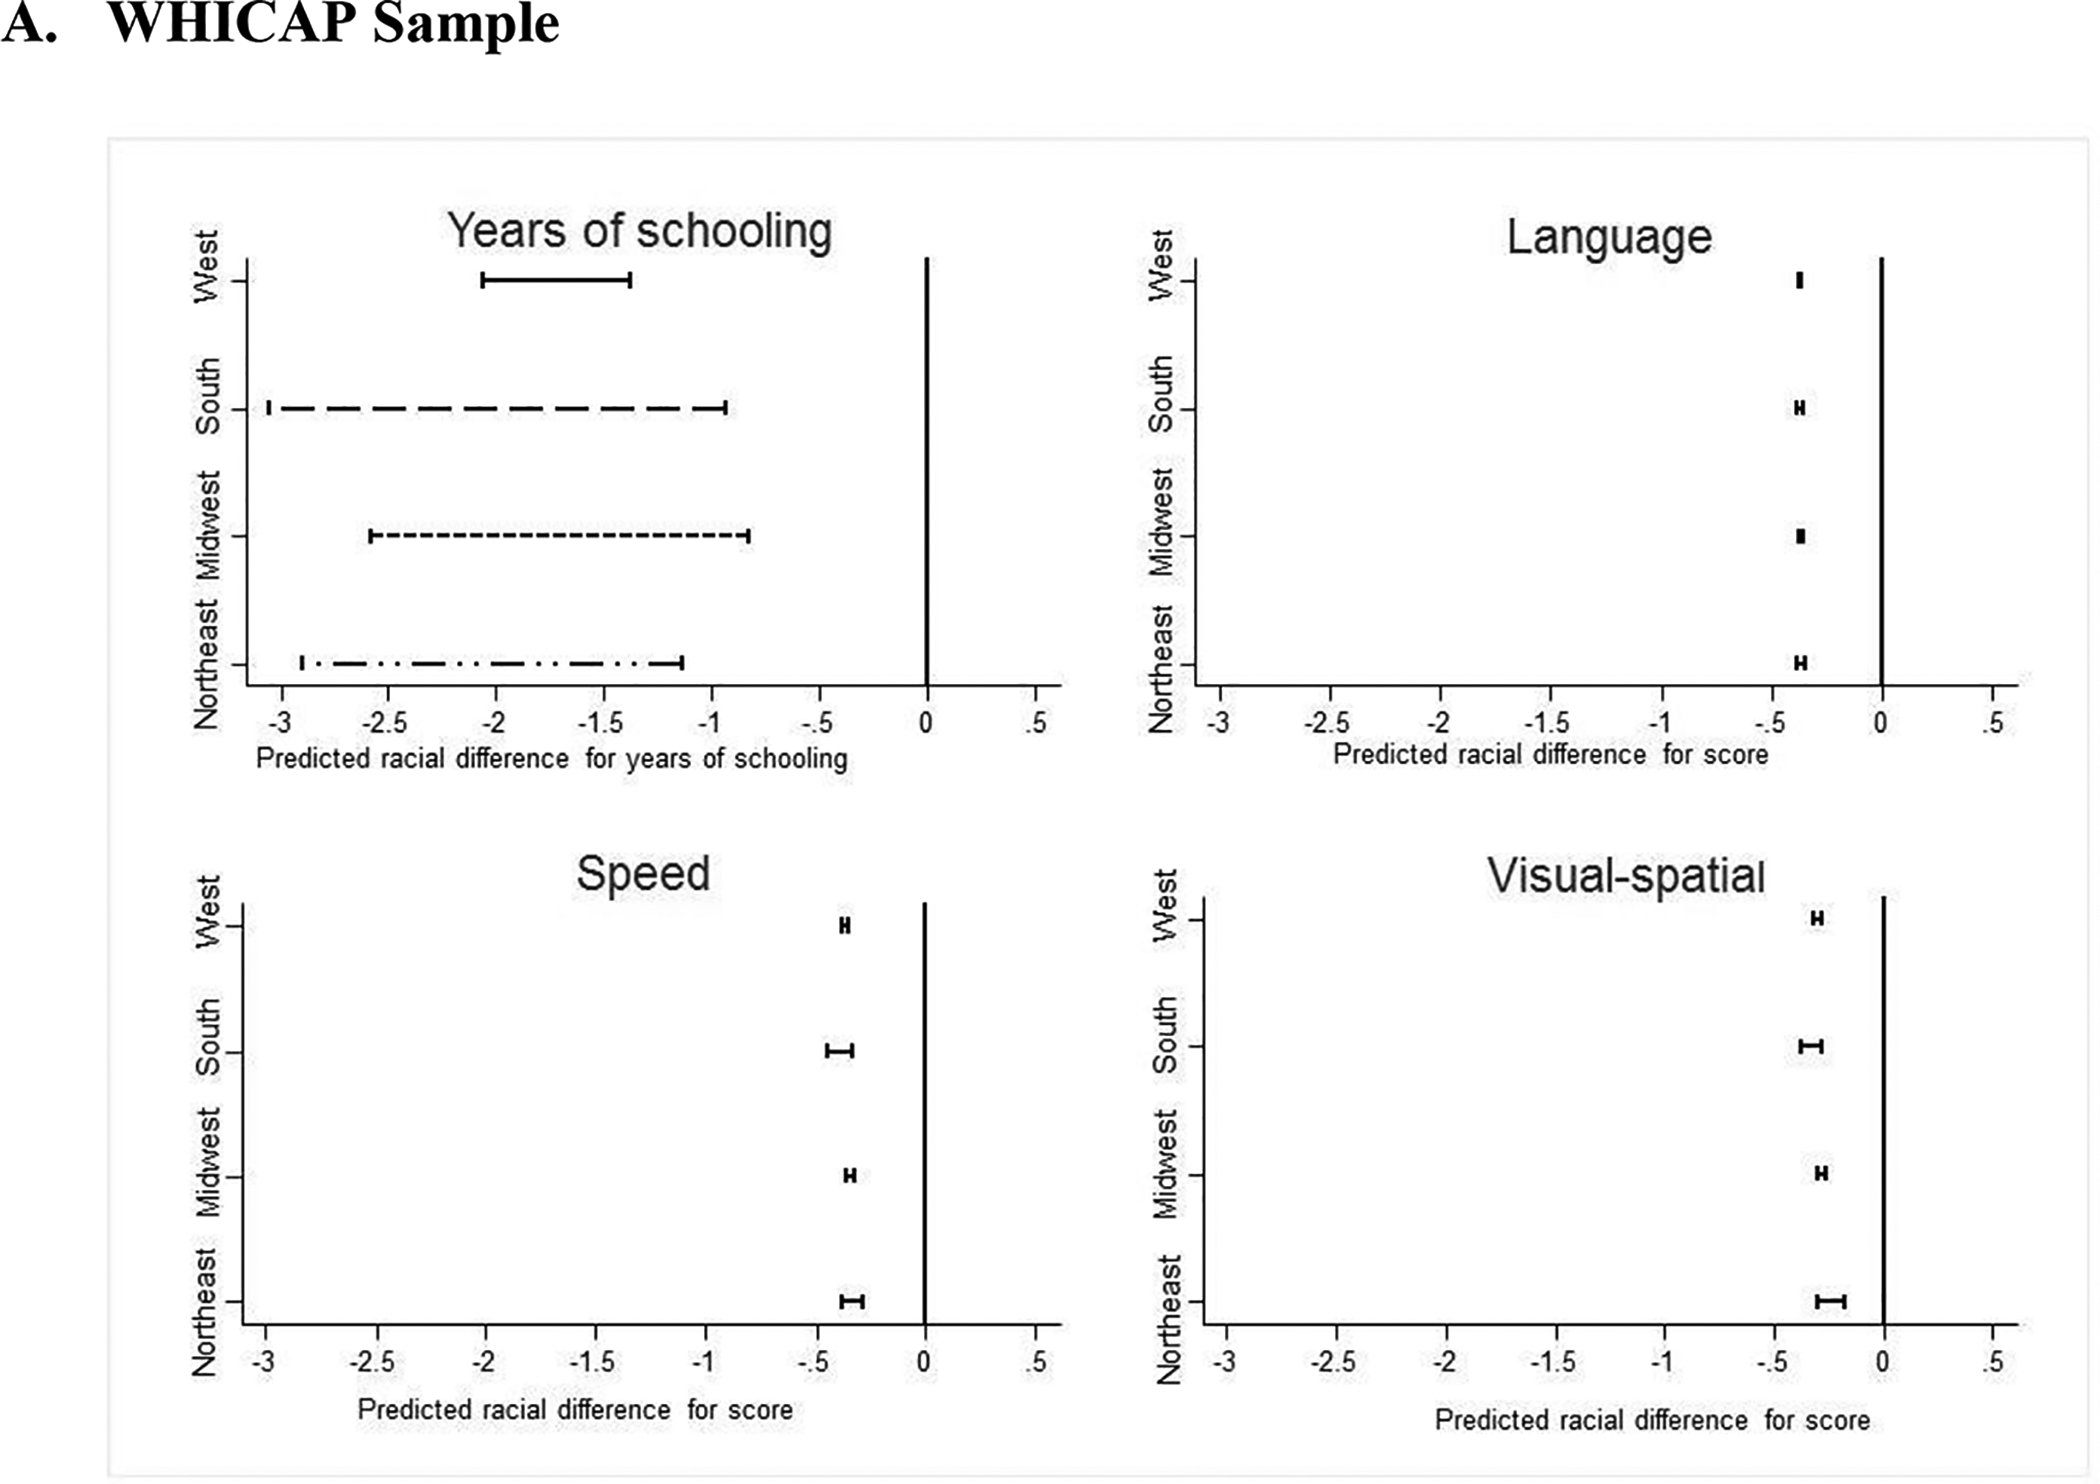
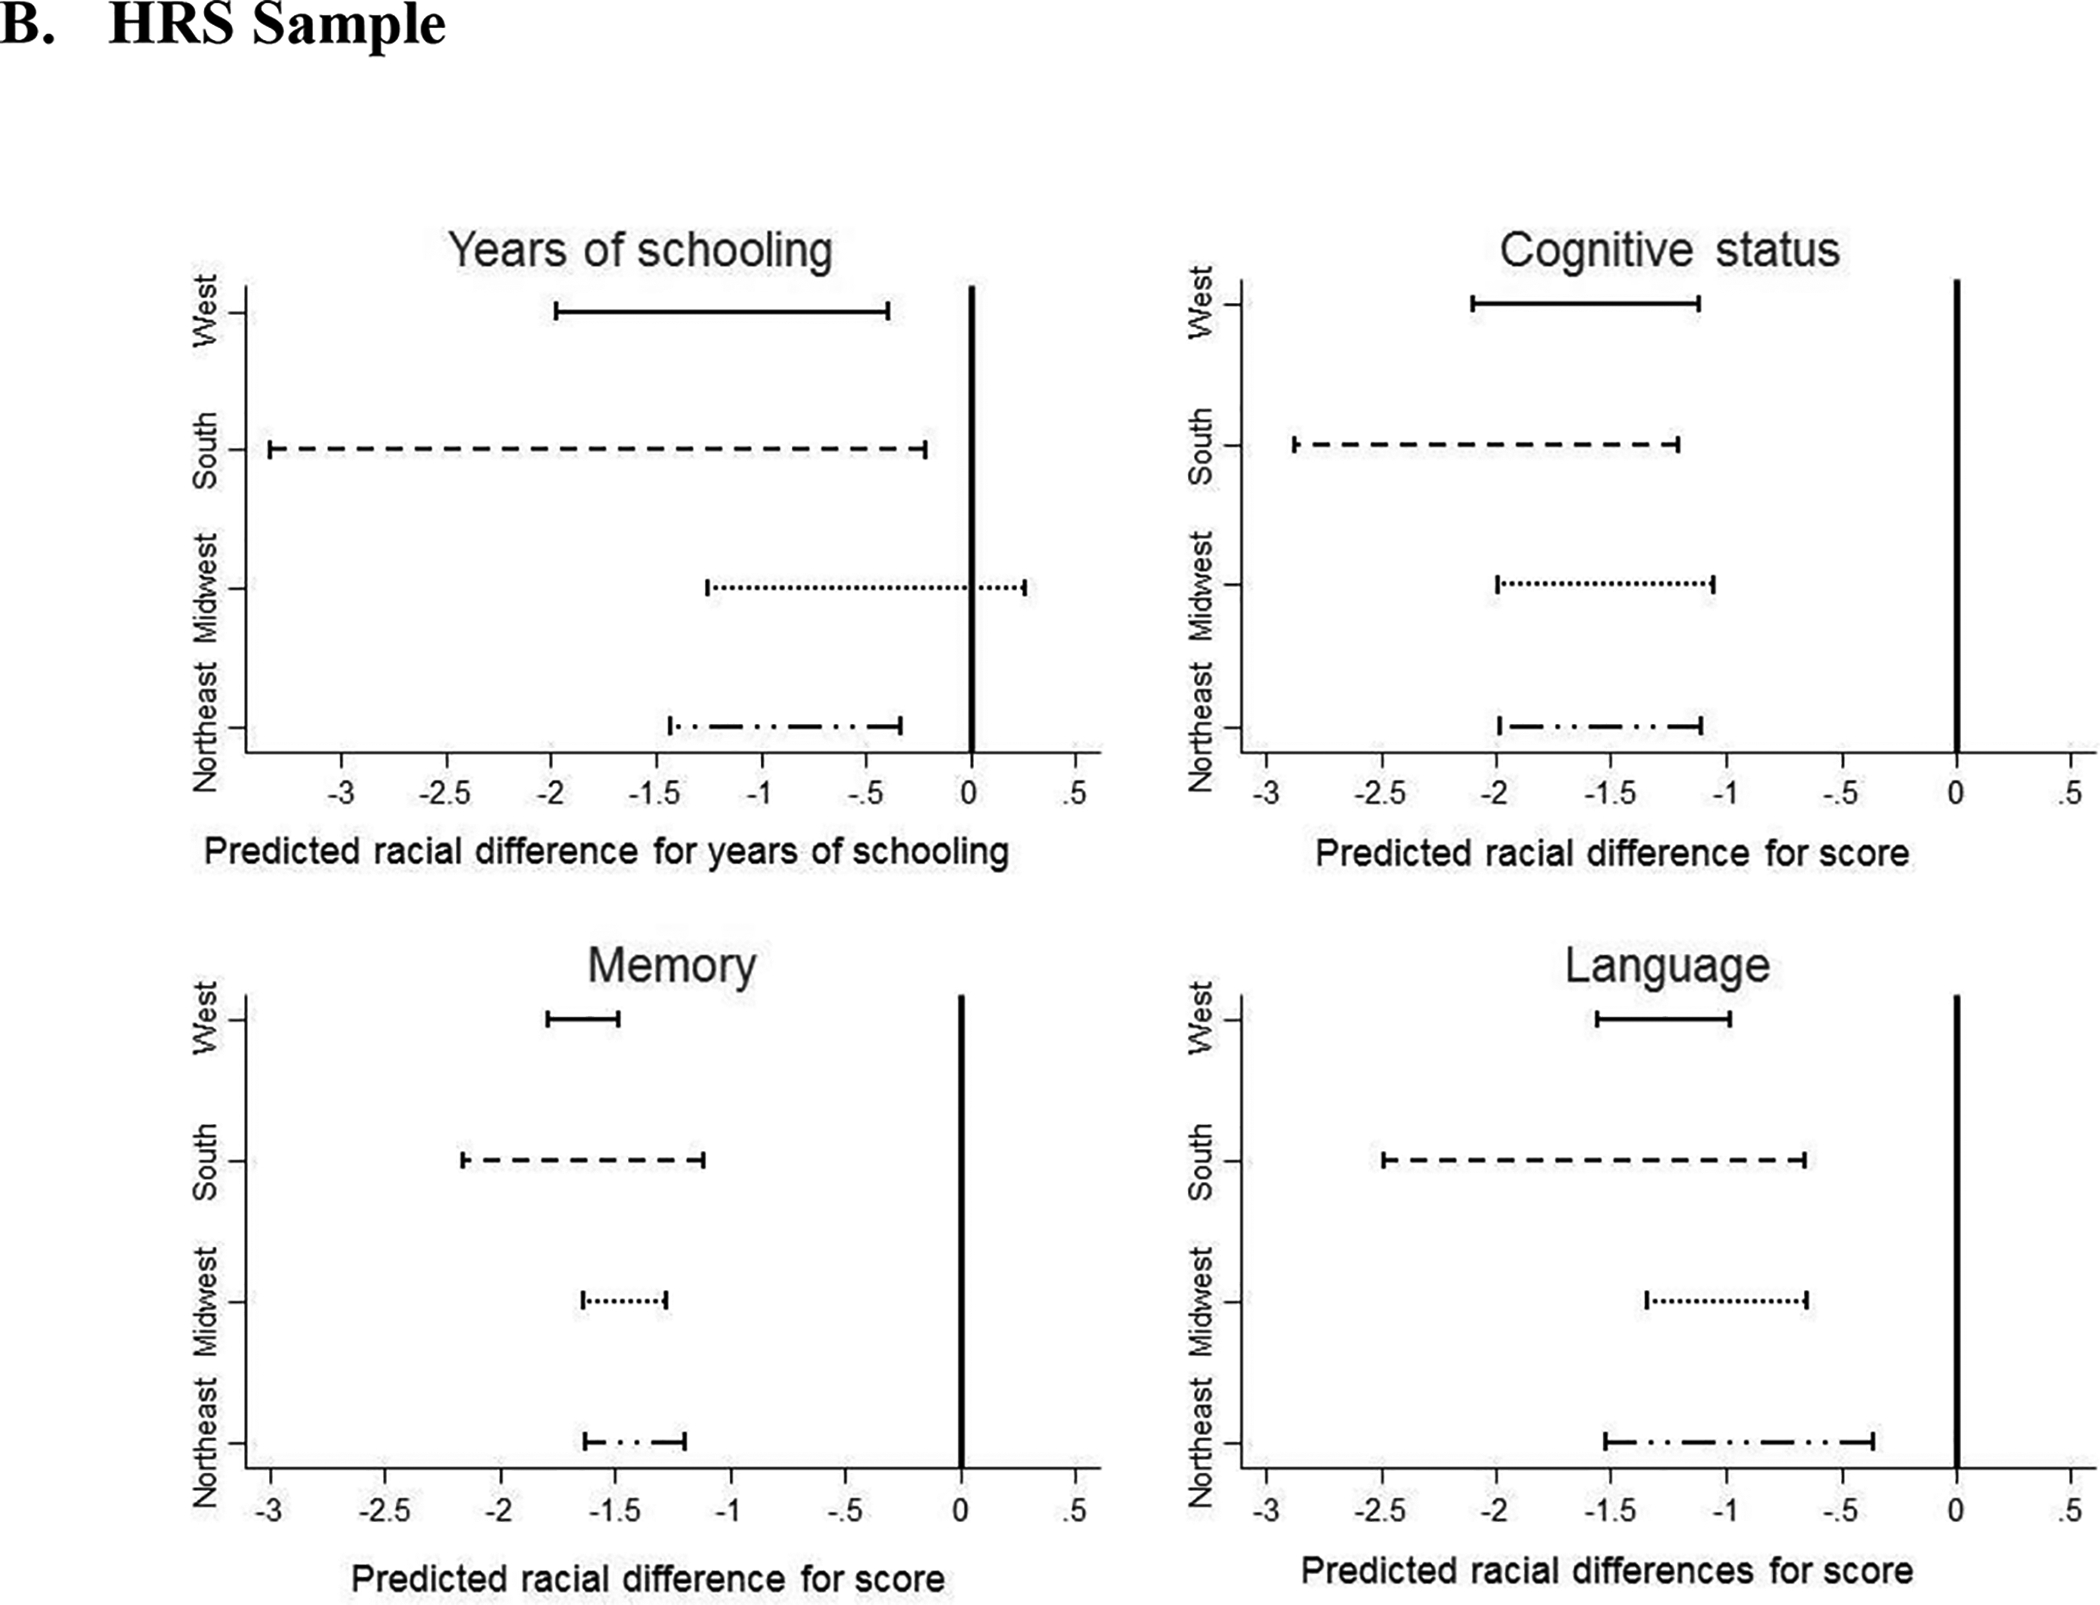
e Solid line depicts the predicted racial difference for the states in the West, the dashed lines for the states in the South, the dotted lines for the states in the Midwest and the lines with the dots and dashes are for the states in the Northeast.