. 2021 Feb 8;10:e57345. doi: 10.7554/eLife.57345

Figure 2. Thousands of gene expression changes occur following hypoxia and re-oxygenation.

(A) Volcano plots representing genes that are differentially expressed (DE) between pairs of conditions (orange dots). (B) Bayesian information criterion (BIC) at increasing numbers of Cormotif correlation motifs following joint modeling of pairs of tests. Genes with a posterior probability of being differentially expressed p>0.5 across all tests are defined as ‘response genes’ and those with p<0.5 as ‘non-response genes’. Inset shows the proportion of all expressed genes that are classified as response genes (green), and non-response genes (magenta). (C) Expression levels of JUN, a response gene, during the course of the experiment. (D) Expression levels of ACTN1, a non-response gene.

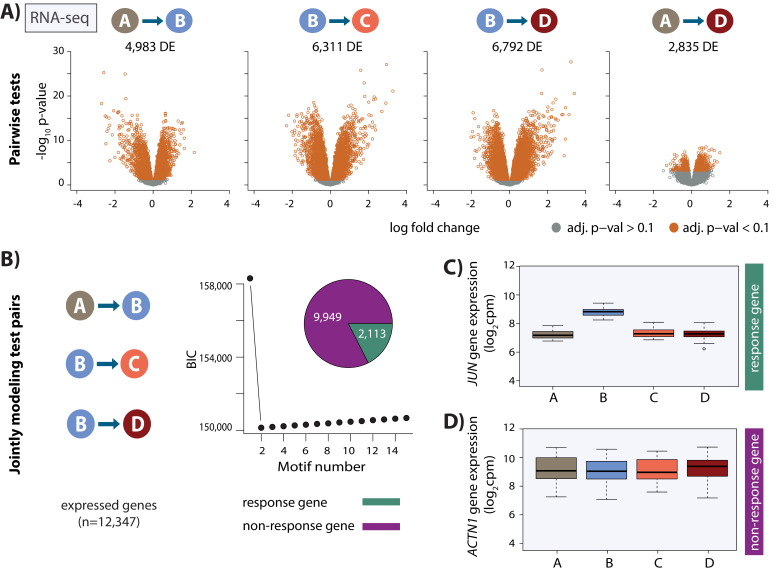
Figure 2.

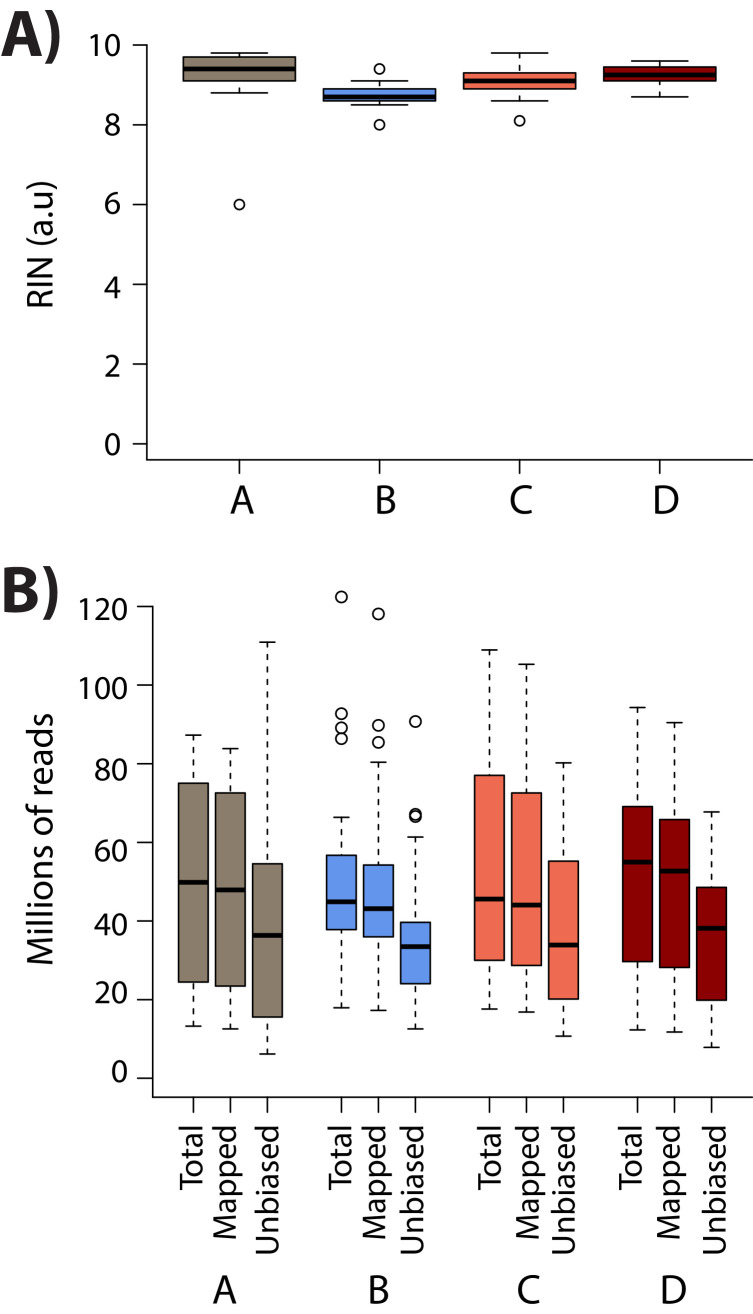
Figure 2—figure supplement 1. RNA integrity is similar across conditions.

Figure 2—figure supplement 1.

(A) RIN score for all samples within each condition. (B) The total number of sequenced reads (Total), the number of reads that map to the human genome (Mapped), and the number of reads that pass the WASP re-mapping step (Unbiased) are shown for each sample within each of the four conditions (A: brown, B: blue, C: coral, D: red).
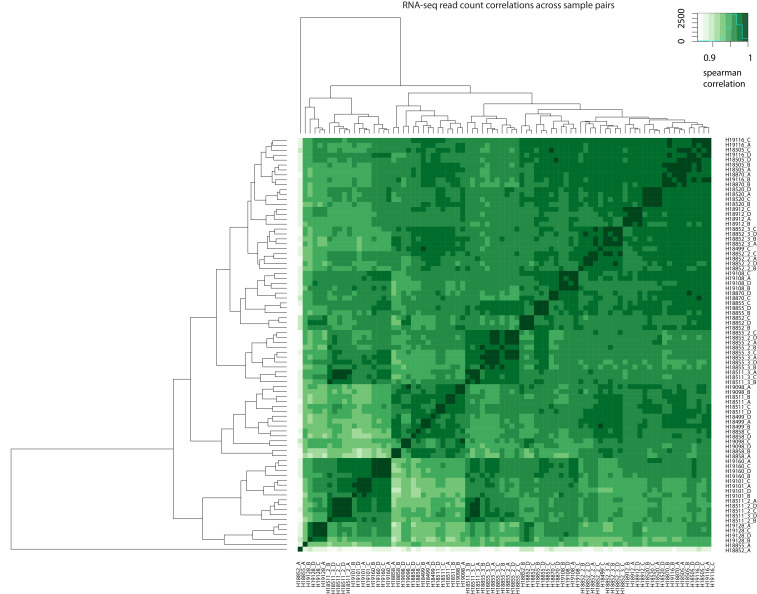
Figure 2—figure supplement 2. Correlation of read counts across samples.

Figure 2—figure supplement 2.

Spearman correlation of RNA-seq read counts between all pairs of samples.
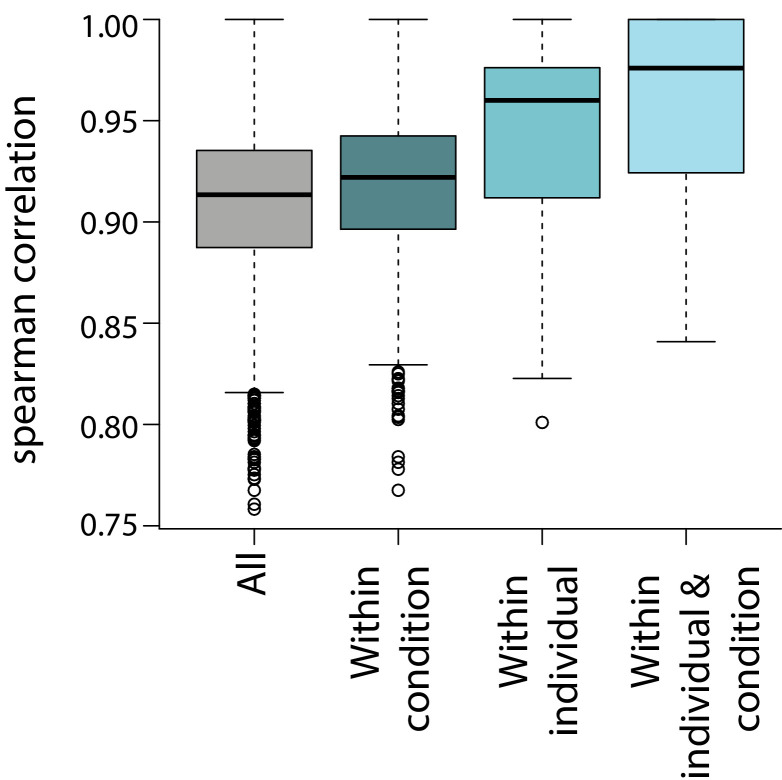
Figure 2—figure supplement 3. Correlation of gene expression measurements across samples.

Figure 2—figure supplement 3.

Spearman correlation between all samples, samples within the same condition, samples from the same individual, and samples from the same condition and individual.
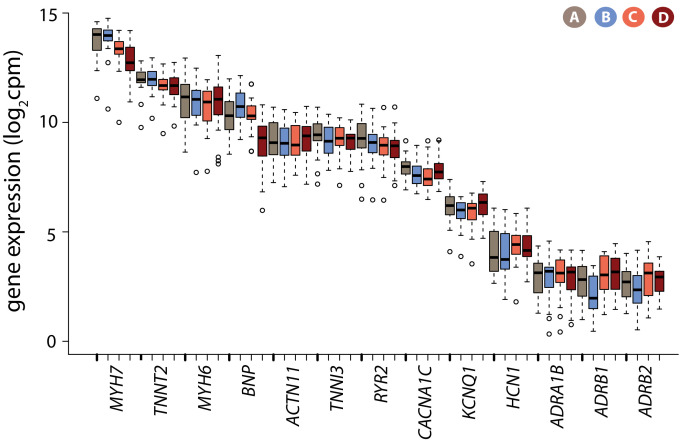
Figure 2—figure supplement 4. Cardiomyocyte marker genes are expressed in iPSC-CMs.

Figure 2—figure supplement 4.

Log2cpm expression levels for a panel of genes known to be expressed in cardiomyocytes in each condition.
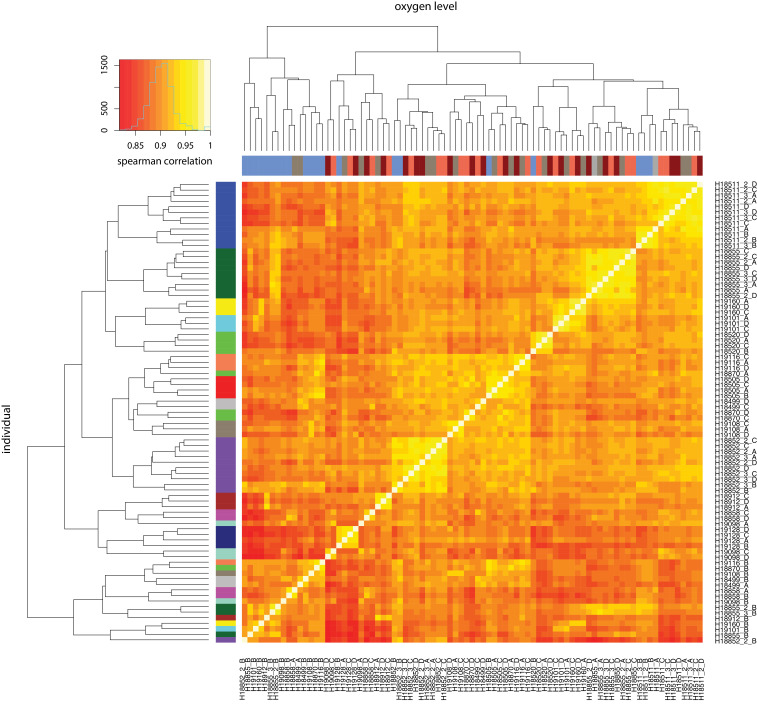
Figure 2—figure supplement 5. RNA-seq samples cluster by oxygen level and individual.

Figure 2—figure supplement 5.

Spearman correlation of RUVs-normalized log2cpm expression levels between all pairs of samples. X-axis: oxygen level: normoxia at 10% oxygen (condition A: brown), 1% oxygen for 6 hr (condition B: blue), re-oxygenation to 10% oxygen for 6 hr (condition C: coral), re-oxygenation to 10% oxygen for 24 hr (condition D: red). Y-axis: individual. All samples from the same individual are represented by the same color.
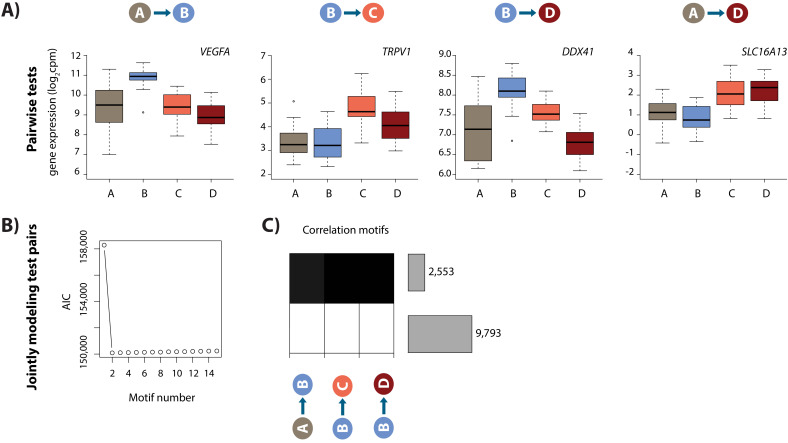
Figure 2—figure supplement 6. Hypoxia and re-oxygenation induces a gene expression response.

Figure 2—figure supplement 6.

(A) Examples of genes that are differentially expressed between each pair of conditions. (B) Akaike information criterion (AIC) at increasing numbers of Cormotif correlation motifs. (C) The two correlation motifs identified by Cormotif. Color represents the posterior probability of genes being differentially expressed between pairs of conditions. The number of genes associated with each motif is plotted on the right. Genes with a p>0.5 across all tests are defined as ‘response genes’ and those with p<0.5 as ‘non-response genes’.