. 2021 Feb 8;10:e57345. doi: 10.7554/eLife.57345

Figure 6. Minimal DNA methylation changes following hypoxia.

(A) Mean DNA methylation levels (Beta-values) in the baseline condition (A) at CpGs within 200 bp upstream of the TSS of non-response genes (NR-G) and response genes (RG), and within all accessible regions (ARs) and differentially accessible regions (DARs; *p<0.05, ***p<0.0005). (B) Volcano plots representing the differential DNA methylation analysis across 766,658 CpGs. There are no differentially methylated (DM) CpGs across any pair of conditions. (C) Numbers of differentially methylated CpGs, when restricting the test set to include only CpGs within CpG islands, across pairs of conditions. (D) Gene expression and DNA methylation levels at a differentially methylated CpG within an intron of the EGR2 response gene.

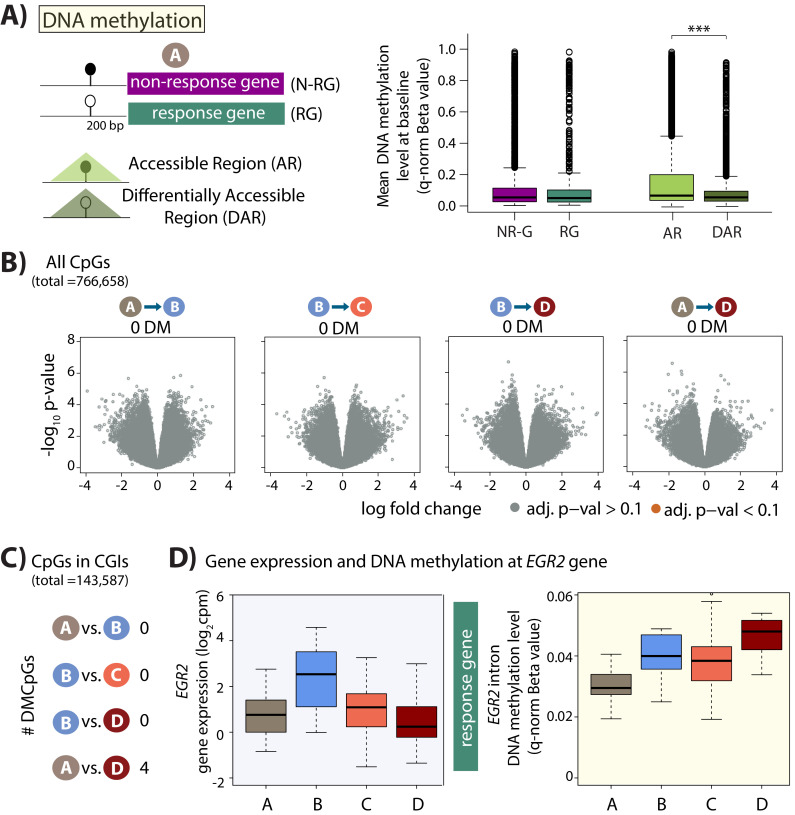
Figure 6.

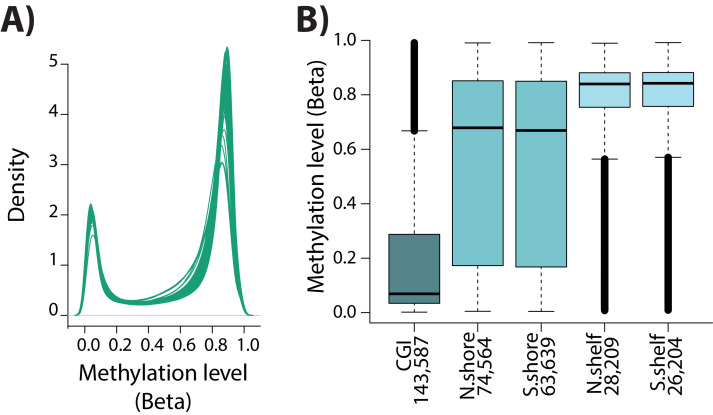
Figure 6—figure supplement 1. DNA methylation array quality control.

Figure 6—figure supplement 1.

(A) The distribution of Beta-values across samples. (B) The Beta-value for each CpG within a CpG island (CGI), CGI north and south shores, and CGI north and south shelves.
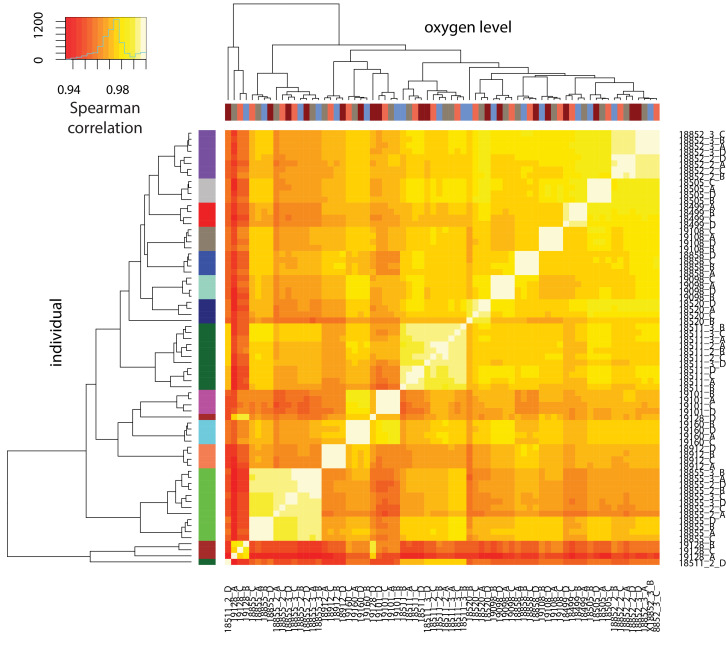
Figure 6—figure supplement 2. DNA methylation levels cluster by individual.

Figure 6—figure supplement 2.

Spearman correlation of quantile-normalized Beta-values for 766,858 CpGs between all sample pairs. X-axis represents oxygen level, and y-axis represents individual.
Figure 6—figure supplement 3. DNA methylation levels are stable across conditions.

Figure 6—figure supplement 3.

Distribution of p-values across each pair of contrasts following differential DNA methylation analysis across 766,658 CpGs.
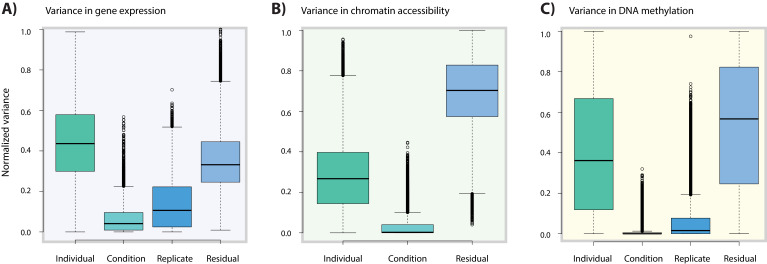
Figure 6—figure supplement 4. Variance associated with oxygen condition is lower in DNA methylation data compared to gene expression data.

Figure 6—figure supplement 4.

(A) Variance in normalized gene expression counts attributed to individual (one of 15 different individuals), condition (A,B,C,D), replicate (all conditions from three individuals replicated three times) and residual variance. (B) Variance in normalized read counts in accessible regions across 14 individuals (no replicate samples were collected). (C) Variance in normalized DNA methylation Beta-values across all CpGs in 13 individuals.