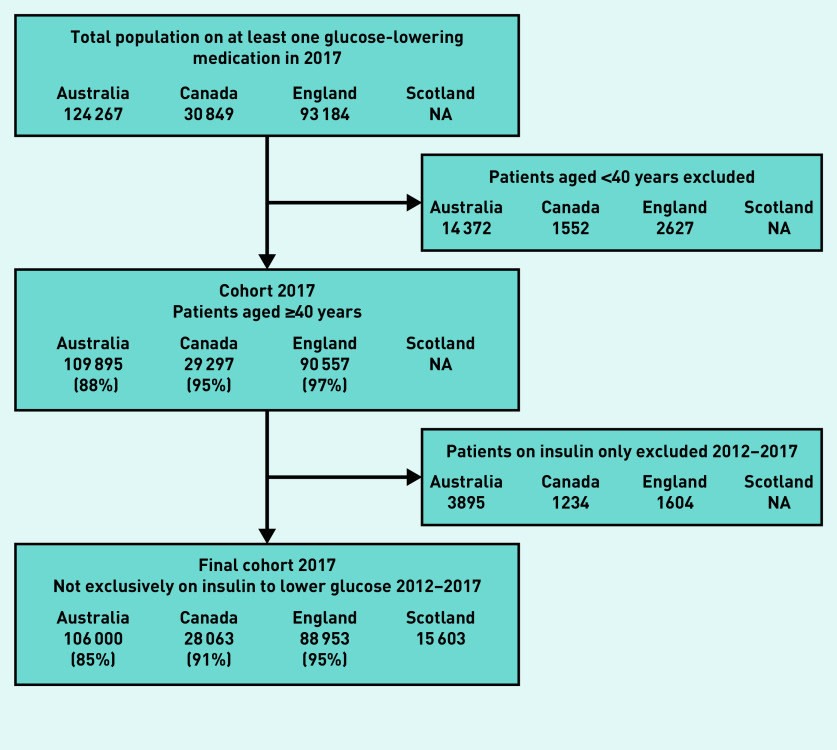
Figure 1.
Flow diagram for generation of cohorts in 2017. Percentages reflect: Numerator: number of patients remaining in cohort. Denominator: number of patients at cohort inception. For example, the England cohort starts at 93 184 patients. Remove 2627 patients aged <40. Remainder is 90 557. (90 557/93 184) × 100 = 97%. NA = not applicable.

