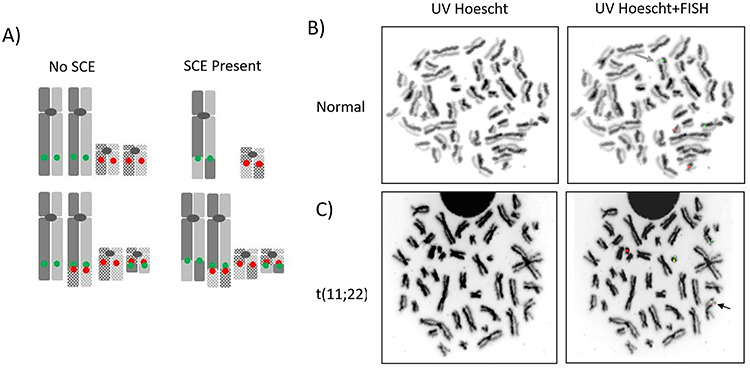
Figure 1.

Detection of SCEs at PATRR sites in lymphocytes using UV-Hoechst exposure coupled with FISH probes. (A) Model depicting an SCE event at the PATRR regions on chromosomes 11 (solid) and 22 (stippled) on both normal and t(11;22) chromosomes with FISH probes for PATRR 11 (green) and PATRR22 (red). (B) Representative metaphase spreads derived from normal peripheral blood lymphocytes visualized by UV-Hoescht plus Giemsa and UV-Hoescht plus FISH probes for PATRR 8 (green) and PATRR 22 (red). The green arrow marks an SCE event at PATRR8. (C) Representative metaphase spreads derived from lymphocytes of a t(11;22) balanced translocation carrier. Images are visualized either by UV-Hoescht plus Giemsa or by UV-Hoescht plus FISH probes for PATRR11 (green) and PATRR22 (red). The black arrows identify an SCE event at PATRR11 on the der11 chromosome. In (B) and (C), black and white images of DAPI counterstained chromosomes enable visualization of SCEs with greater contrast.
