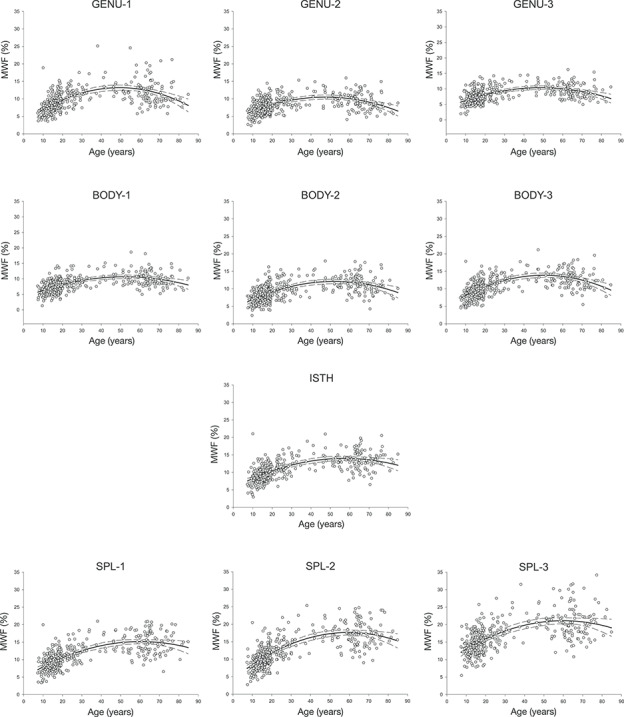
Figure 2.

MWF (%) averaged within each ROI, from anterior to posterior (left to right) for the full sample plus the two age groups defined by the age at the peak value. The error bars represent ±99% confidence intervals (CIs).

MWF (%) averaged within each ROI, from anterior to posterior (left to right) for the full sample plus the two age groups defined by the age at the peak value. The error bars represent ±99% confidence intervals (CIs).