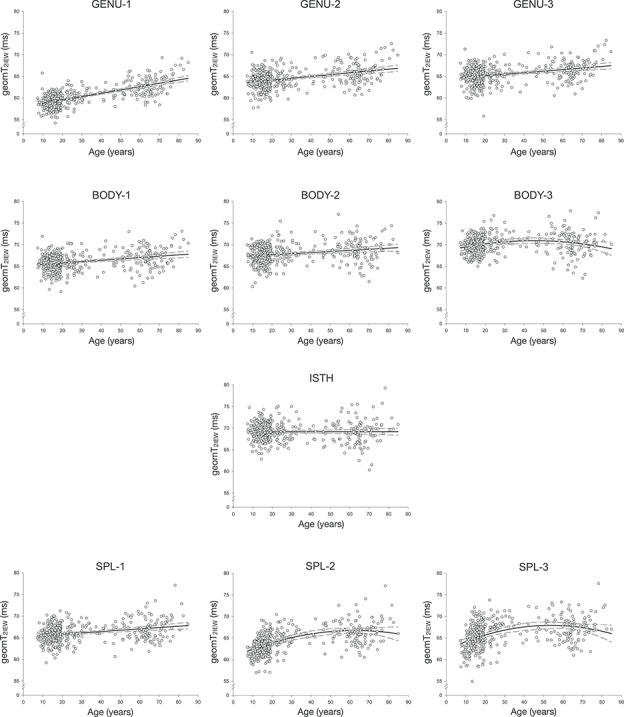
Figure 4.

geomT2IEW (ms) plotted against age for each CC ROI. The pattern of geomT2IEW across the lifespan was best described by a linear function in most ROIs, except the posterior body (BODY-3) and the isthmus (ISTH), which did not exhibit a significant linear relationship between geomT2IEW and age. The ±99% CIs are represented by the dashed lines.
