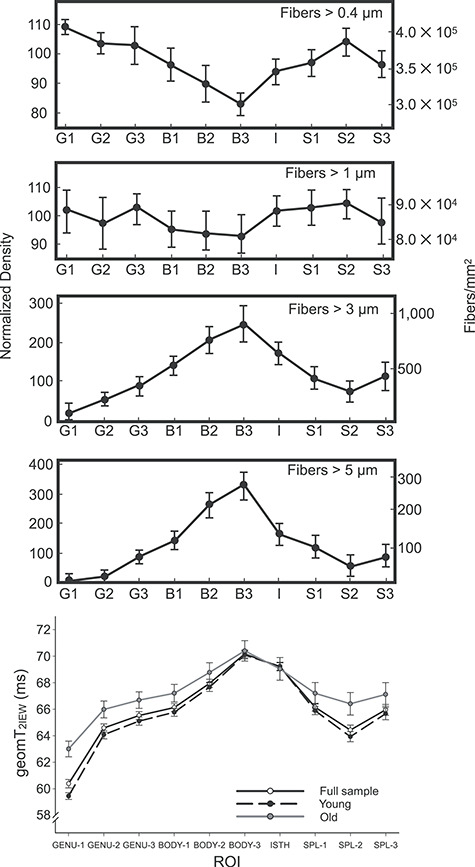
Figure 5.

The first four plots are adapted from Aboitiz et al. (1992). The distribution of large diameter fibers (>3 μm and > 5 μm) closely resembles the pattern of geomT2IEW across all ROIs (bottom) for the full sample plus the two peak-dependent age groups. Error bars in Aboitiz’s graphs represent ±1 SD and the error bars in the geomT2IEW plot represent ±99% CIs.
