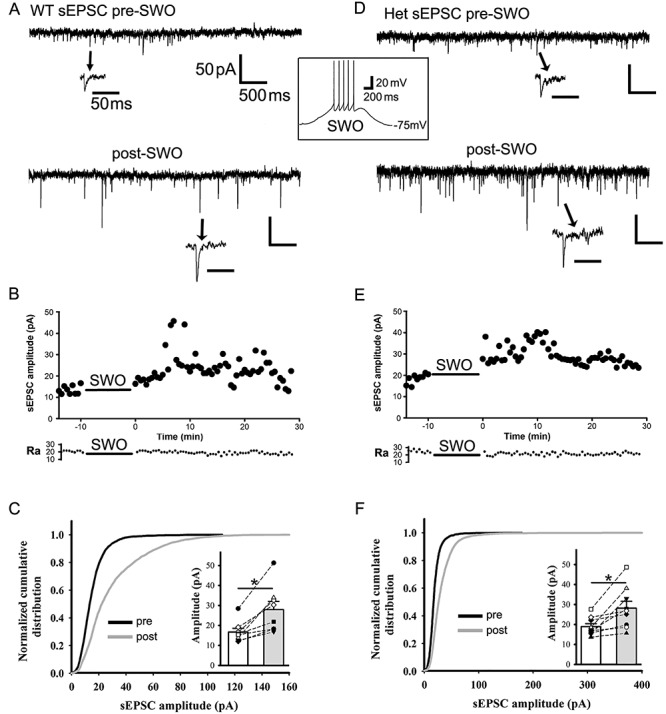
Figure 1.

SWO induction potentiates sEPSCs in layer V cortical pyramidal neurons from wt and het Gabrg2+/Q390X KI mice. Panels A and D are representative traces pre-SWO (top) and post-SWO sEPSCs (lower) for wt littermates (left column) and het KI mice (right column). The arrows point to individual sEPSC events in expanded time scales. The middle inset is one representative SWO induction trace from rest membrane potentials (−75 mV). Scale bars are indicated as labeled. Panels B and E show time courses of pre-SWO and post-SWO sEPSC amplitudes for corresponding recordings from panels A (wt) and D (het). Each data point in the panels B/E was obtained by averaging all sEPSC events during continuous 30 s recordings. The lower panels of access resistance (Ra) show their accompanied values during the whole 42.5 min recordings. Panels C and F show normalized cumulative histogram of sEPSC events for wt and het KI mice. Insets are summary data of pre-SWO and post-SWO sEPSC values (wt n = 8 neurons, n = 5 mice, paired t-test P = 0.004; het n = 9 neurons, n = 6 het KI mice, paired t-test P = 0.009) (wt cumulative curves used 4905 synaptic events for pre-SWO[during 4.2 min baseline recordings for each neuron, total n = 8 neurons] and 4506 synaptic events for post-SWO [during final 4.2 min recordings for each neurons, total n = 8 neurons], while het cumulative curves used 3886 synaptic events for pre-SWO [during 4.2 min baseline recordings for each neuron, total n = 9 neurons] and 9519 synaptic events for post-SWO [during final 4.2 min recordings for each neuron, total n = 9 neurons]). Each data point for inset graphs was obtained by averaging sEPSC events during baseline or post-SWO last 4.2 min recordings.
