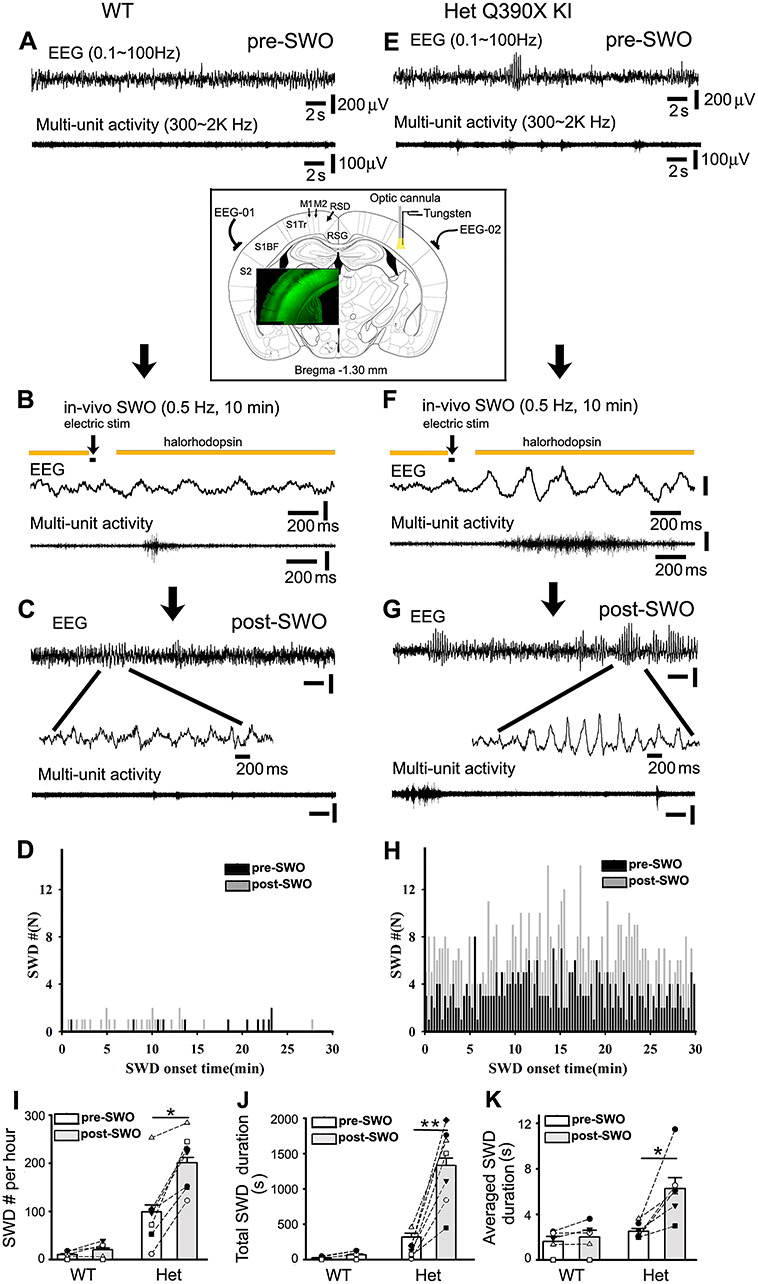
Figure 7.

In vivo induction of SWOs or up-/down-states triggers epileptic SWDs in het Gabrg2+/Q390X KI mice. Panels A (wt) and E (het) are representative traces for simultaneous pre-SWO EEG (top) and multiunit (below) recordings (30 s long). Panels B (wt) and F (het) show the time course of in vivo SWO or up-/down-state induction with yellow color indicating laser delivery, and black bar for intracortical stimulation (20 ms). Below are representative traces (2 s long) for simultaneous EEG/multiunit activity during in vivo SWO induction. Panels C (wt) and G (het) show representative traces for simultaneous post-SWO EEG (top) and multiunit (below) recordings. Below are expanded short episode EEG recordings (wt) or epileptic SWDs (het). Scale bars (panels A, C, E, and G) are similarly indicated as labeled except time-scale bars in panels B and F. The downward arrows indicate experiment sequential steps. Panels D (wt) and H (het) show graphs of pre- (black) and post-SWO (gray) epileptic SWD onset time distribution (cumulative data from all wt n = 6 mice or het mice n = 7 mice). SWD events in these two panels were obtained during 30 min right before and after in vivo SWO induction. Panels I–K show summary data for SWD # per h, total SWD duration and averaged single SWD duration for pre-SWO (blank bars) and post-SWO (gray bars) (het KI mice n = 7 each, SWD #/h, paired t-test P = 0.001; total SWD duration/h, paired t-test P = 0.0008; averaged single SWD duration, paired t-test P = 0.005) (wt mice n = 6 each, SWD #/h, paired t-test P = 0.104; total SWD duration/h, paired t-test P = 0.088; averaged single SWD duration, paired t-test P = 0.165). The insert panel shows the implantation of two epidural EEG-electrodes above S1 cortex and one optic cannula/one bipolar tungsten electrode in the S1 cortex (Bregma −1.30 mm, between Figures 41 and 42, The Mouse Brain in Stereotaxic Coordinates, compact 3rd edition by Franklin and Paxinos (2008). The grounding EEG electrode was implanted above cerebellum surface (not shown here). Green fluorescence imaging (overlay insert) shows Thy1-halorhodopsin expression in the cortex (layer 2/3 and 5/6). Labels S1, M1, and RSD/RSG indicate primary somatosensory cortex, motor cortex, and retrosplenial cortex, respectively.
