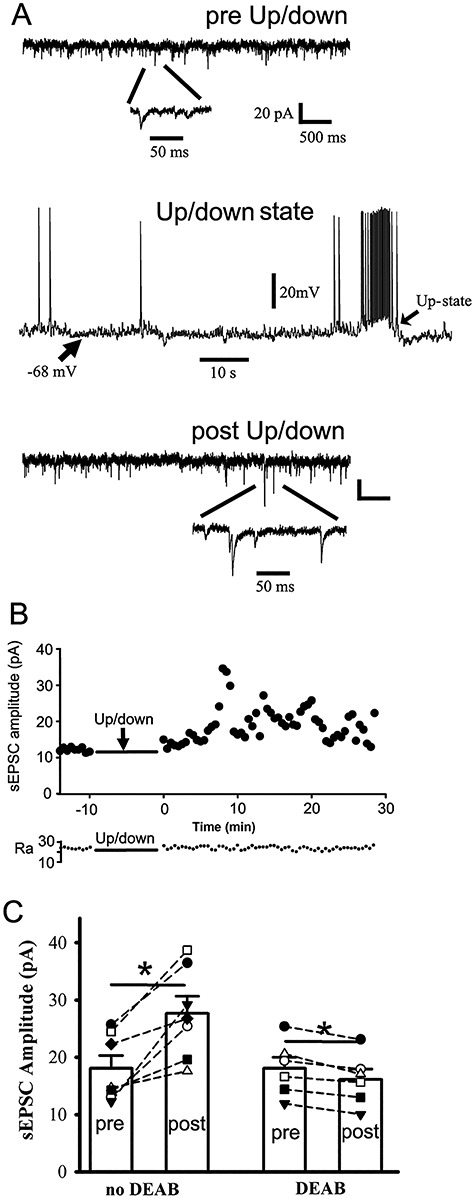
Figure 4.

Physiologically similar up-/down-state induction potentiates sEPSCs in cortical neurons from wt and het Gabrg2+/Q390X KI mice. Panel A (top and bottom) shows representative traces for pre/post-up/down sEPSCs in cortical neurons. Below are expanded sEPSC events. Panel A (middle) shows one representative up-/down-state induced by using fast flow perfusion (6–7 mL/min) with a modified ACSF ([mM] 3.5 or 5 KCl, 1 Ca2+, 1 Mg2+ and 3.5 μM carbachol). Scale bars are indicated as labeled. Panel B shows time courses of pre/post-up-/down-state sEPSC amplitudes for corresponding recordings from panel A. Each data point in these panels B was obtained by averaging all sIPSC events during continuous 30 s recordings. The panel B (lower part) shows access resistance (Ra) values during the whole 42.5 min recordings. Panel C shows summary data of pre-/postup-/down-state sEPSCs (n = 7 neurons, n = 7 mice, paired t-test P = 0.003) and DEAB blockade effect (n = 6 neurons, n = 6 mice, paired t-test P = 0.003) (each data point for panel C was obtained by averaging sEPSC events during baseline or postup-/down-state last 4.2 min recordings).
