Figure 1.

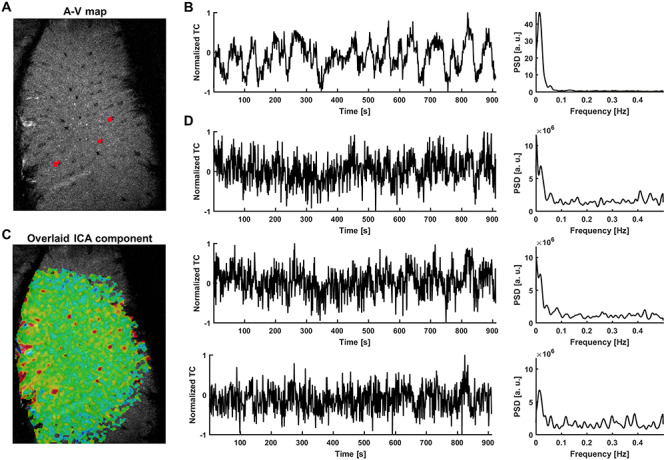
Extraction of signals from single venules exhibiting strong slow fluctuations—rat. (A) The A-V map enables localization of single venules (dark dots) in the rat somatosensory cortex (red—3 vessel masks; plotted in D. (B) Time course of the slowly changing ICA component shaping vascular dynamics and its PSD. (C) The corresponding ICA spatial map highlights the presence of slow fluctuations predominantly in veins. (D) Examples of extracted vascular time courses selected for further processing (marked as red dots on the A-V map in A along with their PSDs. The ICA component is present in the signals, but the noise level is much higher and individual differences are clearly visible.
