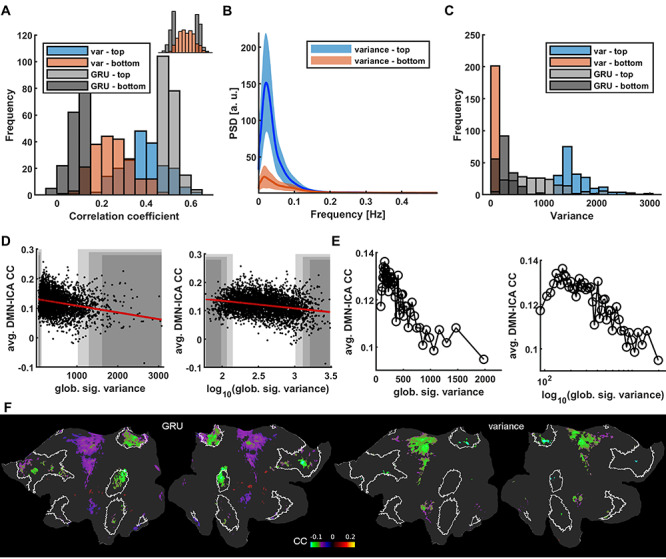
Figure 7.

Differences of RNN scores and global signal variance as indicators of intrinsic DMN activity. (A) Prediction score histograms of the 5% best (light gray) and worst (dark gray) predicted sessions contrasted with prediction scores of signals with top 5% highest (blue) and lowest (red) variance. Variance levels are not conclusive of GRU’s performance. Top right: same data with top and bottom groups merged. (B) Mean PSDs of V1 signals from sessions with the top 5% highest (blue) and lowest (red) global signal variance. Shaded areas show standard deviations. The low power difference is more profound than in the RNN score based case (Fig. 4B). (C) Histogram of variance-based (red and blue) and GRU-based (gray) group variance values. Variances of signals having high or low prediction scores are distributed across the whole range of variance values. (D) Global signal variance and its logarithm of all trials plotted against mean correlations of DMN voxels. Shaded areas cover the top and bottom 2% (dark), 5% and 10% (light) of all scores. (E) Global signal variance and its logarithm of all 4012 trials averaged in 2% bins and plotted against mean correlations of DMN voxels. At low variance values the DMN correlations decrease breaking the trend. (F) Flattened cortical maps showing the difference between the mean DMN-ICA seed-based correlation maps of the 5% “top” and “bottom” groups based on GRU scores and global signal variance values. DMN ROIs are marked by white borders. Nodes in which the differences were insignificant are masked. The intrinsic DMN signals show significantly reduced connectivity with DMN areas.
