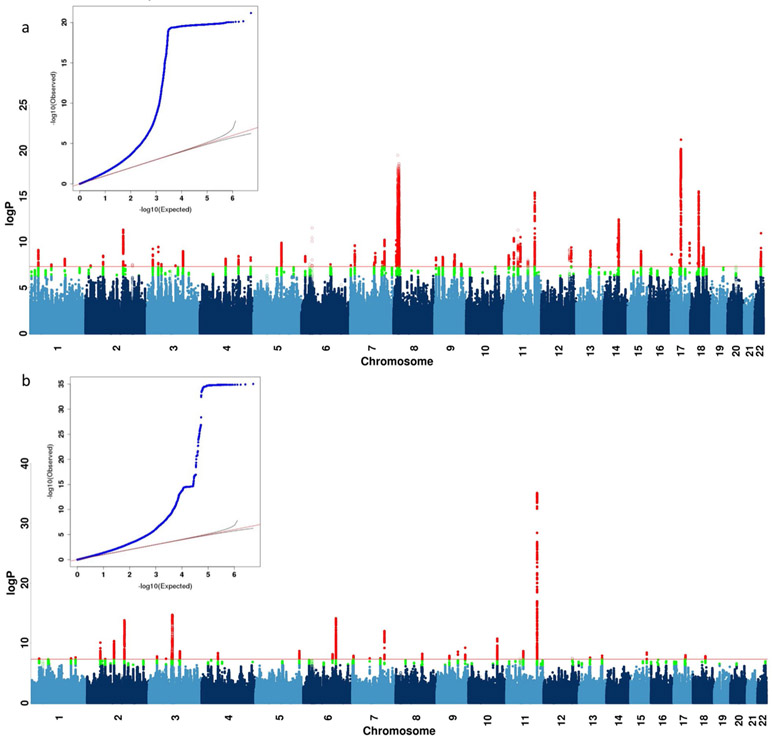
Extended Data Fig. 3 ∣. GWAS on neuroticism and smoking in UK Biobank.
a, b, This figure shows the Manhattan plot of neuroticism score (data field 20127, quantitative trait from 0 to 12) in 274,107 individuals and ever smoked status (data field 20160, binary trait of 0 for “No”, and 1 for “Yes”) in 336,066 individuals in UK Biobank using linear regression on all 8,968,716 common SNPs (MAF > 5% in all 337,198 White-British, unrelated samples) for all the above analyses in PLINK (version 1.9)32 with 20 PCs and genotyping array as covariates. We report all associations with P-values smaller than 5×10⁻⁸ as genome-wide significant (red). We indicated the SNPs in SVs and the MHC in all Manhattan plots as hollow points instead of solid points due to lack of control for population structure in these regions, and show all top SNPs within peaks (1-Mb regions) in Supplementary Tables 10 and 11.

