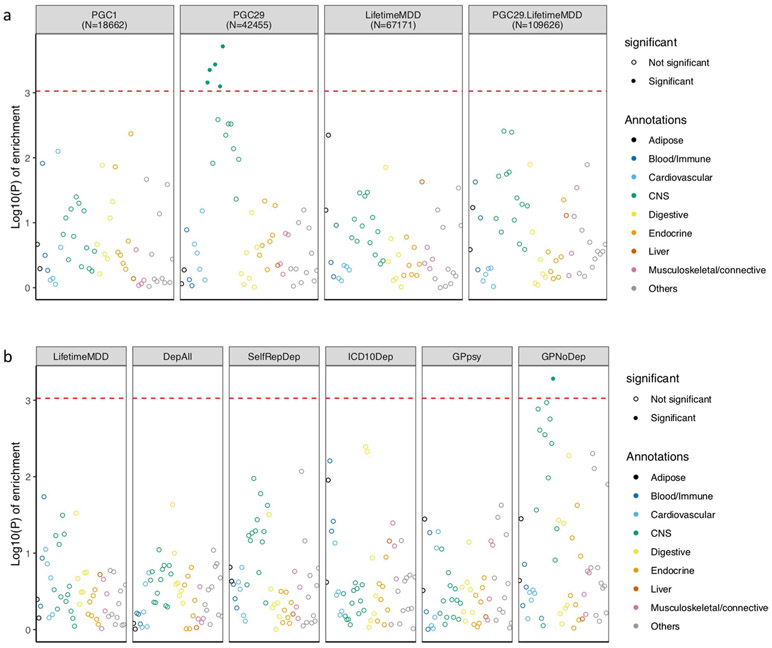
Extended Data Fig. 4 ∣. LDSC-SEG analysis of tissue-specific enrichment of h2SNP.
a, This figure shows −log10(P) of enrichment in heritability in genes specifically expressed in 44 GTEx tissues, estimated using partitioned heritability in LDSC-SEG, on LifetimeMDD (n = 67,171), PGC1-MDD (n = 18,759), PGC29 (n = 42,455) and a meta-analysis of LifetimeMDD and PGC29 (n = 109,626, PC29.LifetimeMDD, Methods). While PGC29 shows CNS enrichment, neither LifetimeMDD nor the meta-analysis shows the same enrichment. This suggests sample size and differences in genetic architecture and cohort heterogeneity affects results from LDSC-SEG. b, This figure shows the same analysis performed on down-sampled data for each definition of depression. Each definition is randomly down-sampled to 7,500 cases and 42,500 controls, a constant prevalence of 0.15, to remove confounding from sample size and difference in statistical power on the enrichment analysis. This figure shows that at equal sample size and prevalence, GPNoDep (no-MDD Help-seeking phenotype) is the only one showing CNS enrichment, suggesting it may be driving the CNS enrichment signal in GPpsy in Fig. 5.

