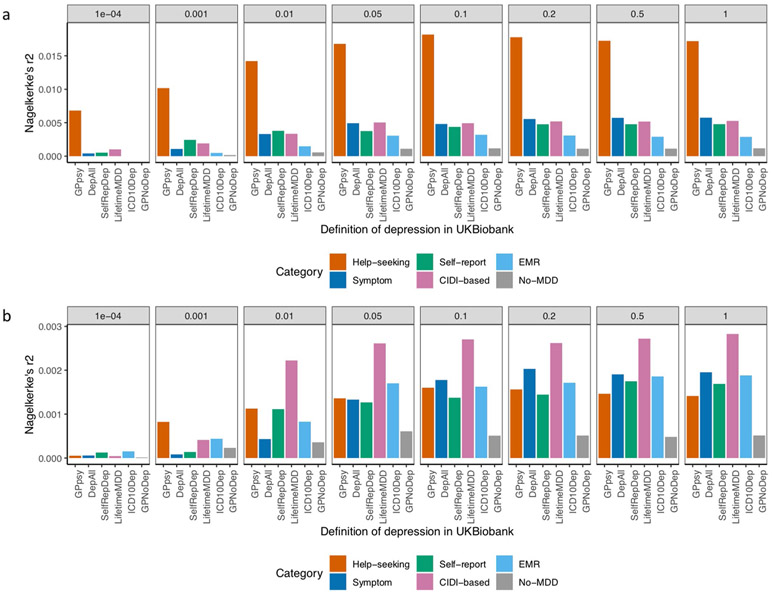
Extended Data Fig. 6 ∣. Out-of-sample prediction in PGC cohorts.
a, This figure shows the Nagelkerke’s r2 of polygenic risk scores (PRS) calculated for each definition of depression in UK Biobank and MDD status indicated in 19 PGC29-MDD cohorts, while controlling for cohort specific effects. PRS were calculated using effect sizes at independent (LD r2 < 0.1) SNPs passing P-value thresholds 10−4, 0.001, 0.01, 0.05, 0.01, 0.2, 0.5 and 1 respectively, in GWAS performed on all definitions of depression in UK Biobank. b, This figure shows the same analysis performed on down-sampled data (7,500 cases, 42,500 controls) for each definition of depression.

