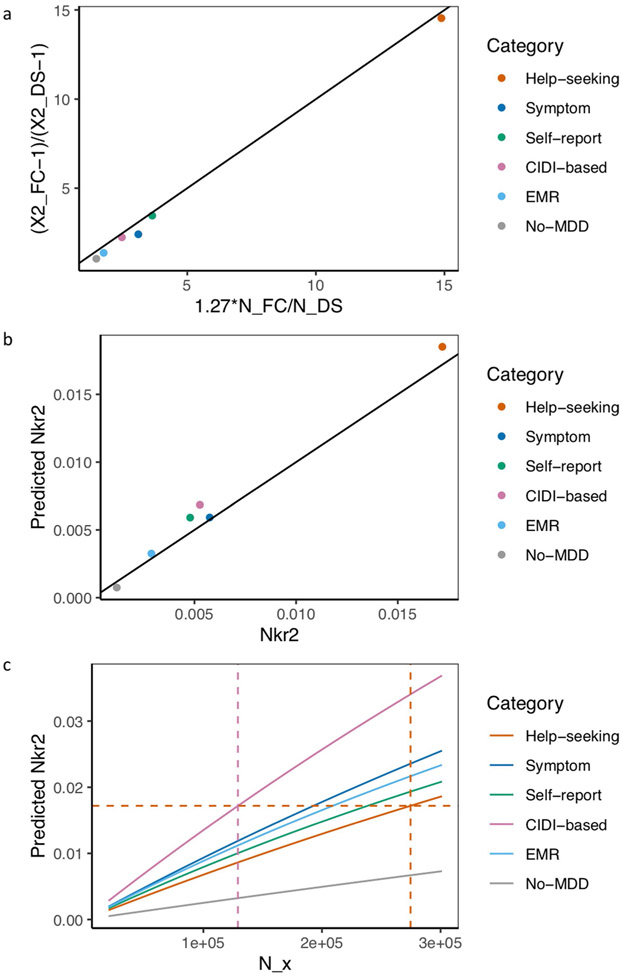
Extended Data Fig. 7 ∣. Relationship between effective sample size and prediction accuracy.
a, This figure shows the relationship between the ratio of effective sample sizes between the full cohort (NFC) and down-sampled (NDS) data for each definition of depression and the ratio of their mean Chi-square (χ2) statistic from GWAS, with black line x = y for reference. Across all definitions of depression, is highly correlated with (Pearson r2 = 0.999, P = 5.50×10⁻⁷), and has an effect of beta = 1.27 (s.e. = 0.02) on . b, This figure shows the Nagelkerke’s r2 (Nkr2) for MDD status in PGC29 cohorts predicted for PRS of different definitions of depression at NFC, plotted against their respective empirical Nkr2 at NFC, both at P-value threshold = 1. The Pearson correlation r2 between predicted and actual NKr2 across all definitions were 0.989 (P = 4.46×10⁻⁵). c, This figure shows for each definition of depression the effective sample size NX required for each predicted Nkr2 in out-of-sample prediction of MDD status in PGC29 cohorts. While Nx= 274,677 (indicated with orange vertical dotted line) for GPpsy to achieve a Nkr2 of 0.0172 (indicated with orange horizontal dotted line), a smaller Nx= 129,106 (indicated with pink vertical dotted line) is needed to achieve the same Nkr2 for LifetimeMDD.

