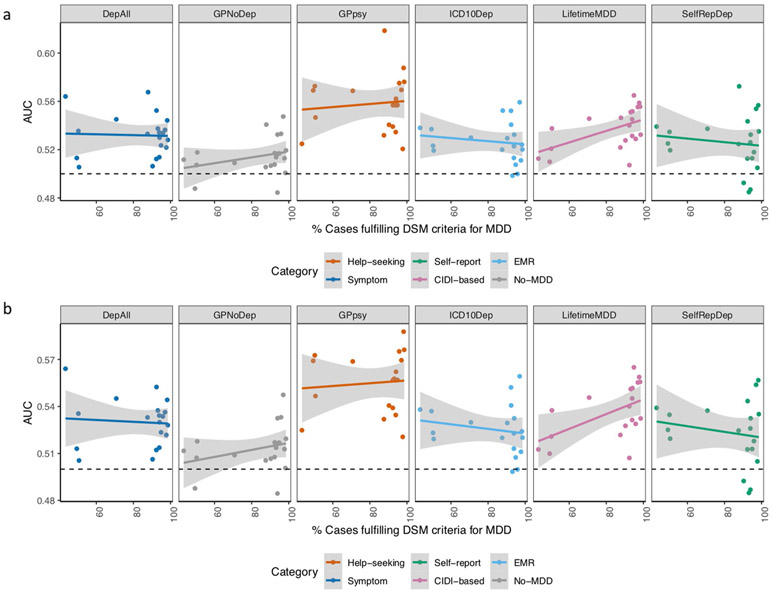
Extended Data Fig. 8 ∣. Prediction accuracy in cohorts with different percentage of DSM MDD cases.
a, This figure shows the area under the curve (AUC) of polygenic risk scores (PRS) calculated for each definition of depression in UK Biobank and MDD status indicated in 20 PGC29-MDD cohorts at P-value threshold of 0.1 (using all SNPs after LD-clumping, see results at all P-value thresholds in Supplementary Table 23), plotting AUC for each cohort against their respective percentage of cases fulfilling DSM-5 criteria A for MDD (see Supplementary Table 21). It shows that strictly defined CIDI-based LifetimeMDD is the only definition of depression in UK Biobank that shows increases in AUC as percentage of cases fulfilling DSM-5 criteria A for MDD in PGC cohorts increases, despite not giving the highest AUC. b, This figure shows the same analysis removing the PGC29-MDD cohort rad3, which is the outlier giving AUC > 0.6 in GPpsy in a. As this is a UK-based cohort, it is possible it contains relatives of individuals in UK Biobank that upwardly biased prediction accuracy in it. For all analysis shown in Fig. 7, Extended Data Figs. 6 and 7 and Supplementary Table 23, we have removed this cohort.

