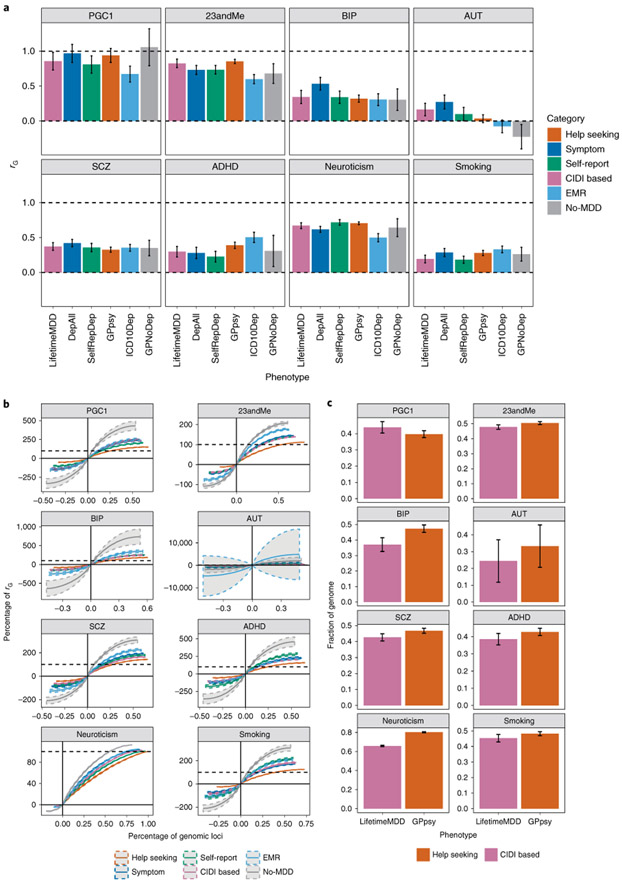
Fig. 4 ∣. Genetic correlation between definitions of MDD and other psychiatric conditions.
a, The genetic correlation estimated by cross-trait LDSC43 on the liability scale between definitions of MDD in the UK Biobank and other psychiatric conditions in both the UK Biobank (smoking and neuroticism) and PGC44 (Supplementary Table 1), including schizophrenia49 (SCZ) and bipolar disorder50 (BIP) (Supplementary Table 1). Error bars show the s.e. of the estimates. AUT, autism; ADHD, attention deficit/hyperactivity disorder. b, The cumulative fraction of regional genetic correlation (out of the sum of regional genetic correlation across all loci) between definitions of MDD in the UK Biobank and schizophrenia in 1,703 independent loci in the genome64 estimated using rho-HESS46, plotted against the percentage of independent loci. CIDI-based LifetimeMDD is shown in purple, while help-seeking-based GPpsy is shown in red. The steeper the curve, the smaller the number of loci explaining the total genetic correlation. The dashed colored curves around each solid line represent the s.e. of the estimate computed using a jackknife approach as described in Shi et al.36 The dashed black line represents 100% of the sum of genetic correlation between each definition of MDD in the UK Biobank and schizophrenia. The cumulative sums of positive regional genetic correlations (right of y axis) go beyond 100%; this is mirrored by the negative regional genetic correlations (left of y axis) that go below 0%. c, We ranked all 1,703 loci by their magnitude of genetic correlation and asked what fraction of loci summed to 90% of total genetic correlation. This figure shows the percentage of loci summing to 90% of total genetic correlation between either LifetimeMDD (in purple) or GPpsy (in red) and all psychiatric conditions tested, with s.e. estimated using the same jackknife approach. The higher the percentage, the higher the number of genetic loci contributing to 90% of total genetic correlation. Error bars show the s.e. of the estimates.

