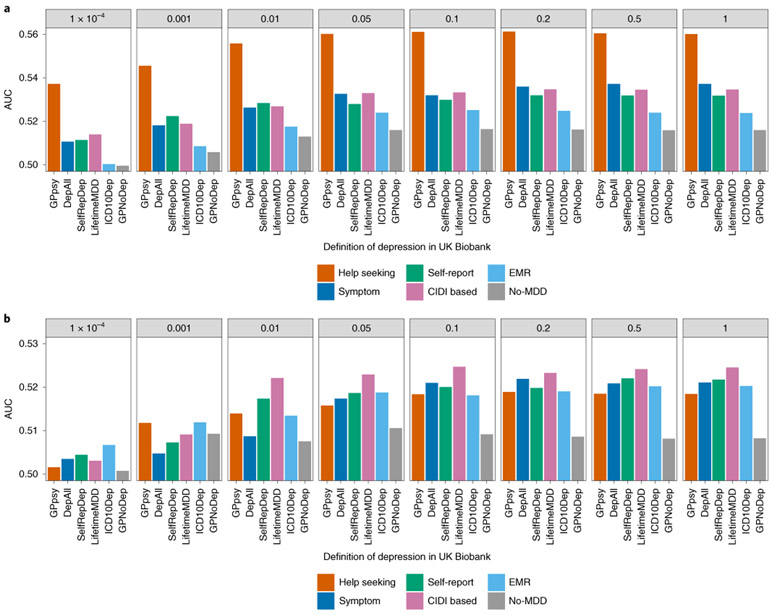
Fig. 7 ∣. Out-of-sample prediction of MDD in PGC cohorts.
a, The AUC of PRSs calculated for each definition of depression in the UK Biobank and MDD status indicated in 19 PGC29-MDD cohorts5, while controlling for cohort-specific effects. PRSs were calculated using effect sizes at independent (LD r2 < 0.1) SNPs passing P-value thresholds of 10−4, 0.001, 0.01, 0.05, 0.01, 0.2, 0.5 and 1, in GWAS performed on all definitions of depression in the UK Biobank. b, This figure shows the same analysis performed on downsampled data (7,500 cases and 42,500 controls) for each definition of depression.

