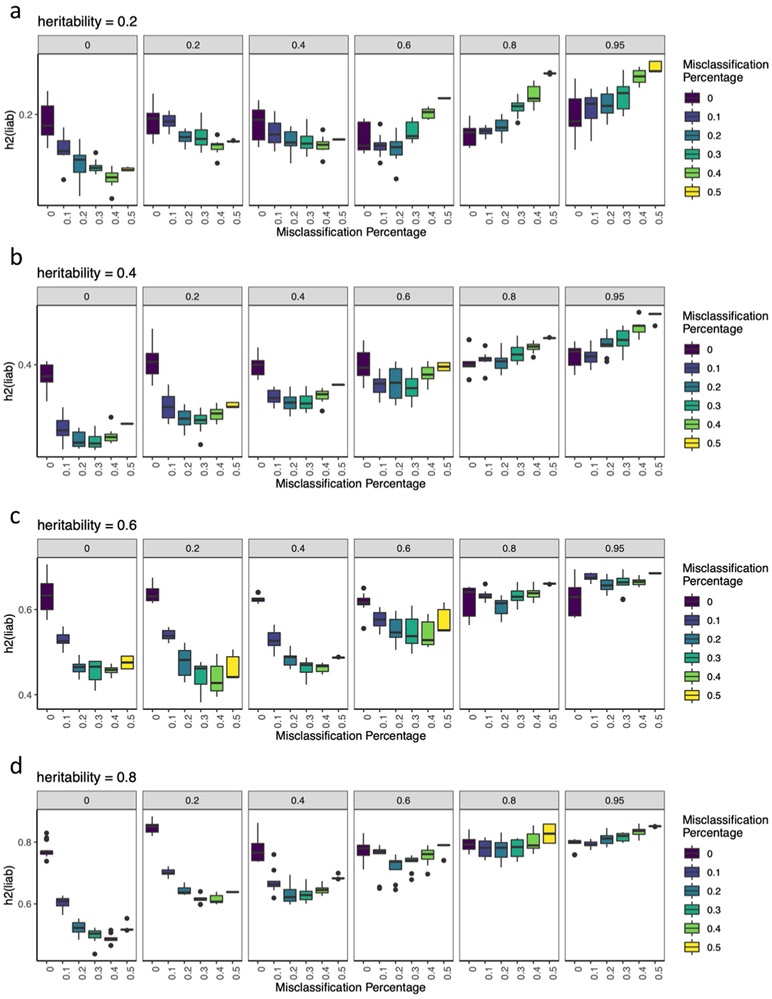
Extended Data Fig. 2 ∣. Simulations of misclassification at different heritabilities.
a-d, These figures shows the estimated h2SNP using-pcgc option with-prevalence K in LDAK, plotted on the y-axis) of binary traits (yi,1, where i ∈{1..10}) with simulated 0.2, 0.4, 0.6, and 0.8, for each of which all cases (at prevalence Ki,1 = 0.2) are correctly identified as cases, while varying numbers of cases misclassified from a genetically correlated binary trait (yi,2, where i∈{1..10}) of equal and prevalence as cases of yi,1. Genetic correlations between yi,1 and yi,2 (rGi∈{0, 0.2, 0.4, 0.6, 0.8, 0.95}) are shown in the grey bars above each panel. Each boxplot show h2SNP estimates from 10 simulated phenotypes, with upper and lower boundaries of boxes represent the first to third quartiles of all estimates, and the whiskers extends to 1.5 times the interquartile range of the estimates.

