
Figure 3.
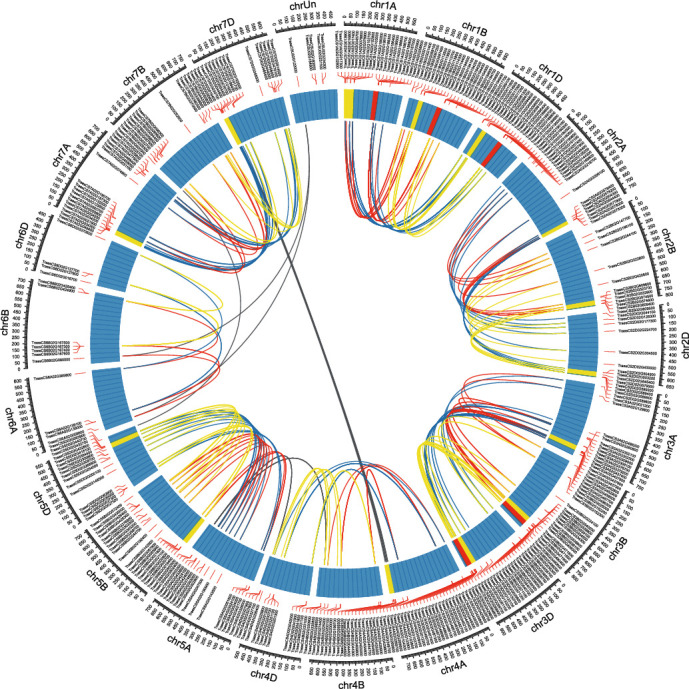
Genome-wide synteny analysis of glutathione S-transferase (GST) genes in common wheat. Syntenic GST gene pairs belonging to the same linkage group between AA and BB, AA and DD, and BB and DD are linked with red, blue, and yellow lines, respectively. Syntenic GST gene pairs between different linkage groups are linked with gray lines. The heat map track indicates the density distribution of GST genes.