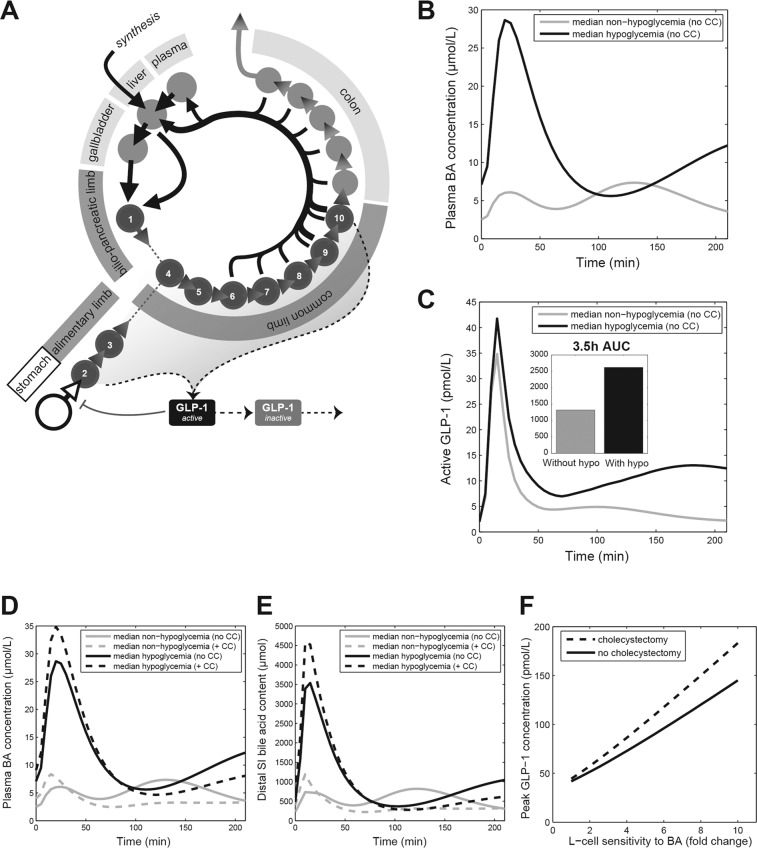
Fig. 3. . Mathematical modelling analysis of the bile acid and GLP-1 response to RYGB.
A Overview of post-RYGB model structure (B) Simulated plasma BA responses mirroring the hypoglycemia and non-hypoglycemia groups. To recreate the observed BA and GLP-1 concentration curves, simulations were performed for a range of values for fasting transit speeds (here, all three fasting intestinal transit parameters are changed by the same factor) and the postprandial transit response. The responses that most closely recreated the median fasting and peak postprandial BA concentrations were chosen for comparison and simulation. For more information, see the Supplementary Figure. C Simulated active GLP-1 concentrations (D) Plasma bile acid concentrations for selected simulations and associated cholecystectomized simulation. E Distal BA content for simulations introduced in D. F To illustrate how the difference in distal BA between non-cholecystectomized subjects and cholecystectomized subjects propagates to the GLP-1 response, the peak GLP-1 concentration is given for a range of sensitivities of L cells for BA. The chosen values range from the assumed L-cell sensitivity for BA in the normal situation, to ×10 that value (fold change). CC cholecystectomy.

