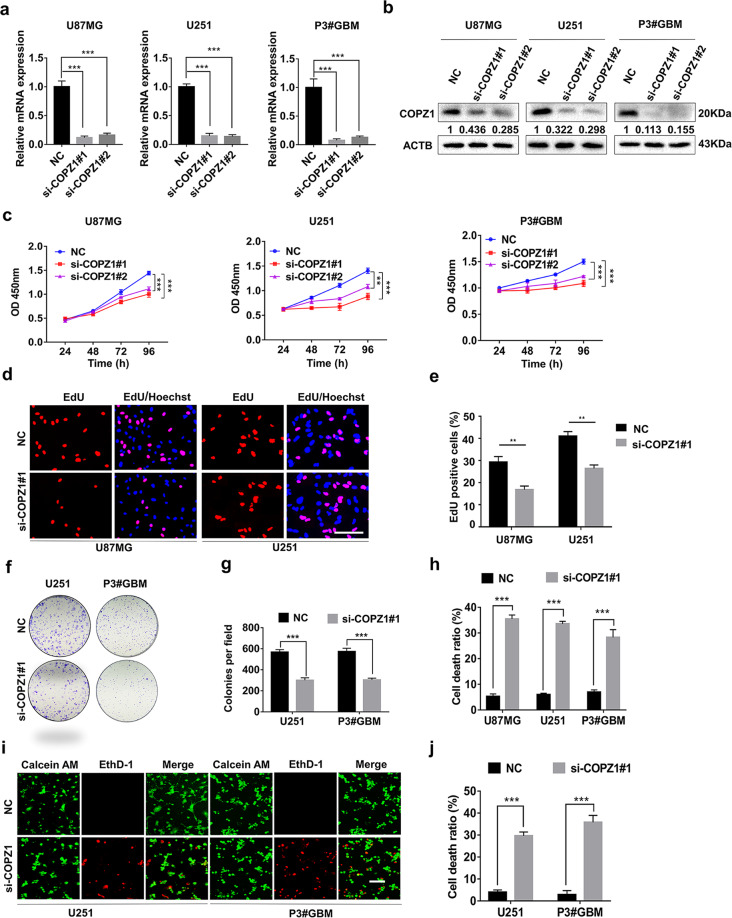
Fig. 2. Silencing of COPZ1 inhibits GBM cell viability and proliferation.
a qRT-PCR to detect COPZ1 mRNA levels in U87MG, U251, and P3#GBM cells transfected with two independent COPZ1 siRNAs, si-COPZ1#1, and si-COPZ1#2. b Western blot analysis of COPZ1 protein levels in U87MG, U251, and P3#GBM cells transfected with si-COPZ1#1 and si-COPZ1#2. c Growth curves for si-COPZ1 transfected U87MG, U251, and P3#GBM cells generated with OD 450 readings plotted over time using the CCK8 assay. d Fluorescence images of EdU assays performed on U87MG and U251 cells transfected with si-COPZ1#1. Nuclei were stained with DAPI (blue). Scale bar, 100 μm. e Graphic representation of the ratios of EdU positive cells in U87MG and U251 cells transfected with si-COPZ1#1. f Representative images of colony forming assays for U251 and P3#GBM cells transfected with si-COPZ1#1 to evaluate cell proliferation. Cells were fixed and stained with crystal violet, and colonies were counted. g Graphic representation of the number of colonies shown in (f). h LDH release assay for si-COPZ1#1 transfected U87MG, U251, and P3#GBM cells compared to their respective control cells. i Representative images of live (green)/dead (red) assays for U251 and P3#GBM cells transfected with si-COPZ1#1. Scale bar, 100 μm. j Graphic representation of the rate of dead (red) cells in U251 and P3#GBM cells transfected with si-COPZ1#1. Student’s t test for two-group comparison: *p < 0.05, **p < 0.01, ***p < 0.001; one-way ANOVA for multi-group comparisons: *p < 0.05, **p < 0.01, ***p < 0.001.

