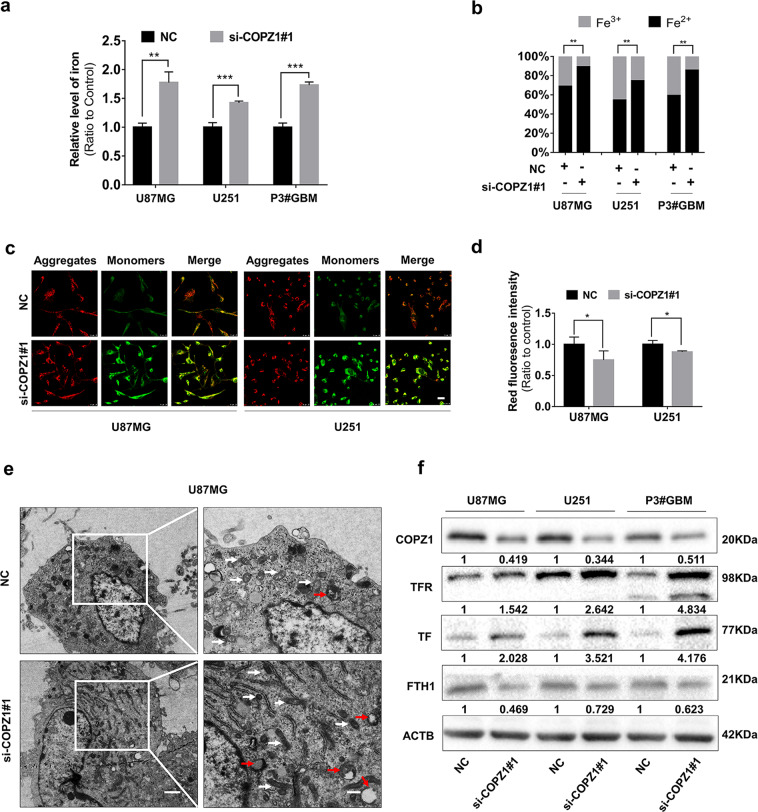
Fig. 3. COPZ1 knockdown induces changes in iron metabolism.
a Total intracellular iron in U87MG, U251 and P3#GBM glioma cells after transfection with si-COPZ1#1 at 24 h. b Graphic representation of the levels of intracellular ferrous iron compared to ferric iron, as evaluated with the colorimetric iron assay kit. c Representative fluorescence images of U87MG and U251 cells stained with the JC-1 probe to assess mitochondrial membrane potential. Scale bar, 25 μm. d Statistical analysis of the red and green fluorescence shown in (c). e Images from transmission electron microscopy showing morphology of mitochondria (white arrows) and formation of autophagosomes (red arrows) in U87MG cells transfected with si-COPZ1#1 for 24 h. Mitochondria show increased membrane density (white arrows) and a shrunken morphology. Scale bar,1.2 μm (left) and 0.6 μm (right). f Western blot analysis of TFR, TF, and FTH1 in lysates prepared from U87MG, U251, and P3#GBM cells transfected with si-COPZ1#1. Student’s t test: *p < 0.05, **p < 0.01, ***p < 0.001.

