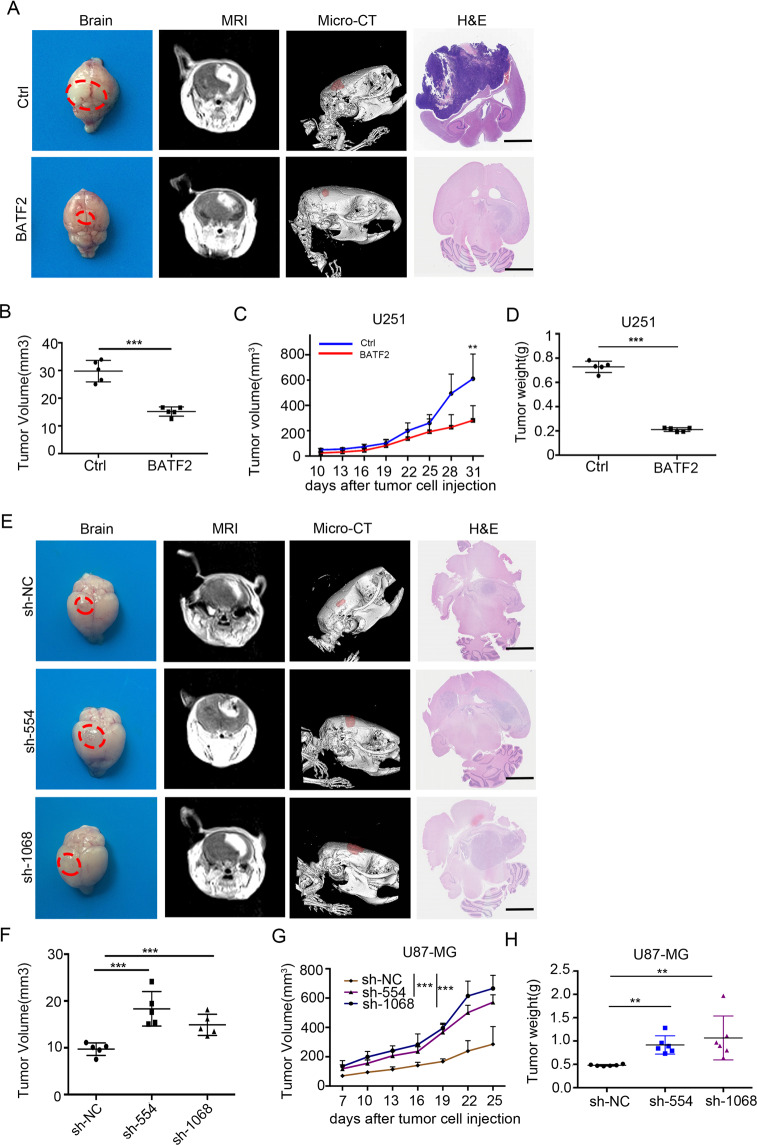
Fig. 1. BATF2 overexpression inhibits GBM tumourigenesis.
A Representative tumour, MRI images (35 days), 3D-Micro-CT images (35 d), and H&E (35 d) of U251-Ctrl and U251-BATF2 group. Red dotted area highlights tumour area. Scale bars,100 μm. B The average intracranial tumour volume (n = 5, *p < 0.05, **p < 0.01, ***p < 0.001). C The average subcutaneous tumour volume of U251-Ctrl and U251-BATF2 (n = 5, *p < 0.05, **p < 0.01, ***p < 0.001). D The average subcutaneous tumour weight of U251-Ctrl and U251-BATF2 (n = 5, *p < 0.05, **p < 0.01, ***p < 0.001). E Representative tumour, MRI images, 3D-micro-CT images, and H&E images of U87-sh-NC, U87-sh-554 and U87-sh-1068 group. Red dotted area highlights tumour area. Scale bars,100 μm. F The average intracranial tumour volume (n = 5, *p < 0.05, **p < 0.01, ***p < 0.001). G The average tumour volume of U87-sh-NC, U87-sh-554 and U87-sh-1068 (n = 6, *p < 0.05, **p < 0.01, ***p < 0.001). H The average tumour weight of U87-sh-NC, U87-sh-554 and U87-sh-1068 (n = 6, *p < 0.05, **p < 0.01, ***p < 0.001).

