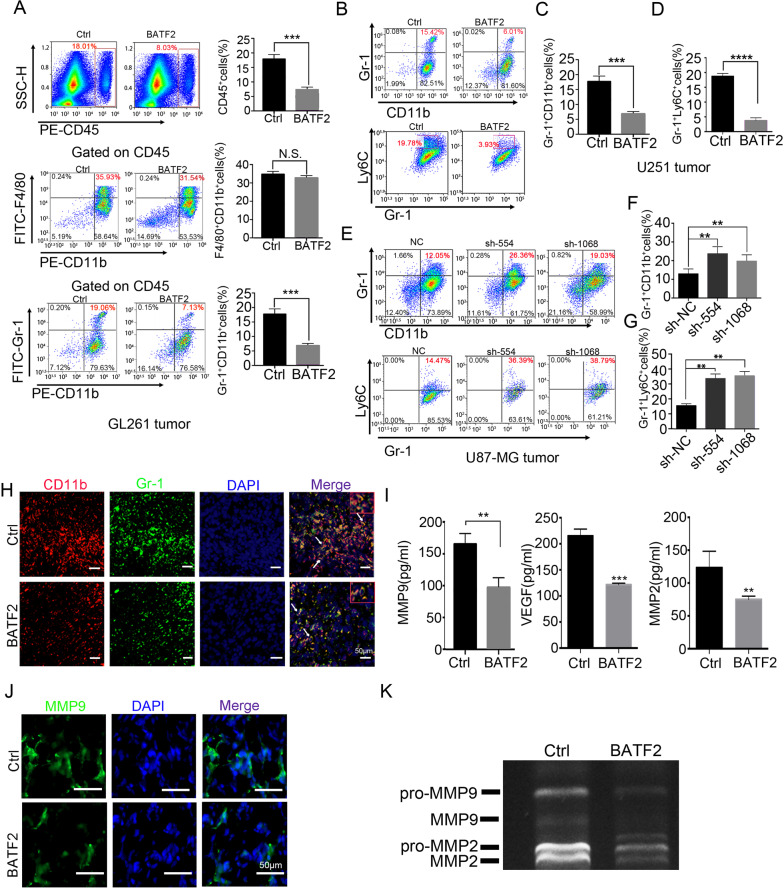
Fig. 2. BATF2 inhibits the recruitment of monocyte-derived MDSCs to tumour microenvironment.
A FACs analysis and statistics of BMDMs in GL261-Ctrl and GL261-BATF2 subcutaneous tumours after 15 days injection (n = 3, independent experiment, *p < 0.05, **p < 0.01, ***p < 0.001). B FACs analysis of GR-1+CD11b+MDSCs and Ly-6C+Gr-1+Mo-MDSCs/MDSCs in U251-Ctrl and U251-BATF2 after 15 days injection. C Statistics of CD11b+Gr-1+ MDSCs in U251-Ctrl and U251-BATF2 after 15 days injection (n = 3, independent experiment, *p < 0.05, **p < 0.01, ***p < 0.001). D Statistics of Gr-1+Ly-6C+ Mo-MDSCs/CD11b+Gr1+ MDSCs in U251-Ctrl and U251-BATF2 after 15 days injection (n = 3, independent experiment, *p < 0.05, **p < 0.01, ***p < 0.001). E FACs analysis of CD11b+Gr-1+MDSCs and Gr-1+Ly-6C+Mo-MDSCs/CD11b+Gr-1+ MDSCs in U87-sh-NC, U87-sh-554 and U87-sh-1068 after 15 days injection. F Statistics of CD11b+Gr-1+ MDSCs in U87-sh-NC, U87-sh-554 and U87-sh-1068 after 15 days injection (n = 3, independent experiment, *p < 0.05, **p < 0.01, ***p < 0.001). G Statistics of Gr-1+Ly-6C+ Mo-MDSCs/CD11b+Gr-1+ MDSCs in U87-sh-NC, U87-sh-554 and U87-sh-1068 after 15 days injection (n = 3, independent experiment, *p < 0.05, **p < 0.01, ***p < 0.001). H Representative images of immunofluorescent staining with Gr-1 (green), CD11b (red) and DAPI (blue) in U251-Ctrl and U251-BATF2 intracranial tumours. White triangles indicate the MDSCs. Scale bars, 50 μm. I. ELISA detection of MMP-9, MMP2, VEGF in U251-Ctrl and U251-BATF2 intracranial tumours (n = 3, independent experiment, *p < 0.05, **p < 0.01, ***p < 0.001). J Representative images of immunofluorescent staining with MMP-9 (green) and DAPI (blue) in U251-Ctrl and U251-BATF2 intracranial tumours. Scale bars, 50 μm. K Zymogram analysis of U251-Ctrl and U251-BATF2 tumours.

