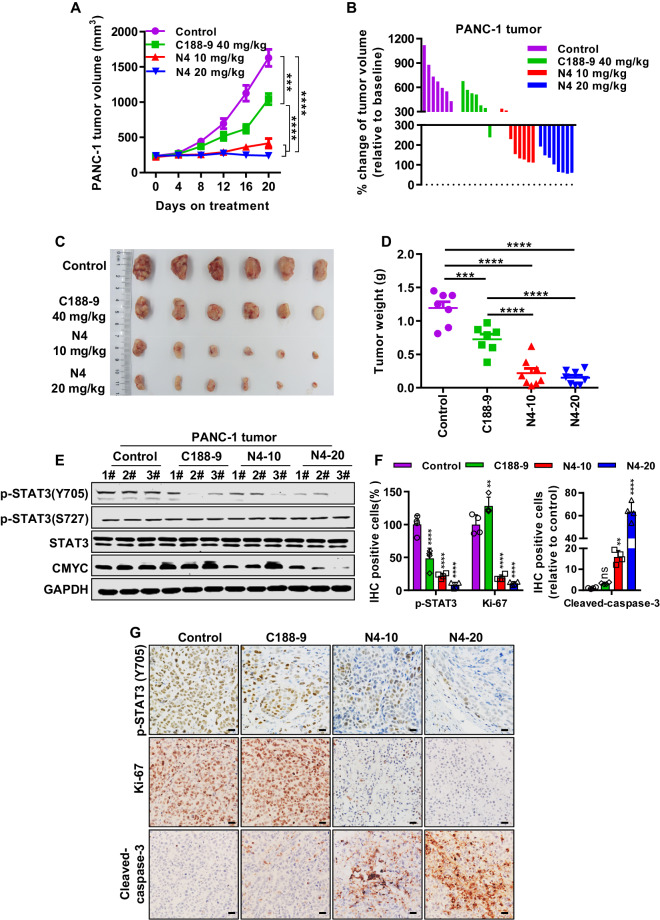
Fig. 5. N4 suppresses pancreatic cancer growth in vivo.
PANC-1 cells were injected into the right flank of BALB/c-nude mice. After the volume of tumor nodules reached 200–300 mm3, the mice were randomly assigned to the indicated groups and were injected intraperitoneally daily with vehicle (n = 7), 40 mg/kg/d C188-9 (n = 7), 10 mg/kg/d N4 (n = 8), or 20 mg/kg/d N4 (n = 8). The mice were sacrificed after treatment for 20 days and the tumors from each group of mice were excised. A, B Tumor volumes were measured every 4 days. Tumor volumes were calculated by the formula: length × width2 × 0.52. These data are expressed as mean ± SD; ***P < 0.001 and ****P < 0.0001 by one-way ANOVA. C After treatment for 20 days, the tumors from each group of mice were excised and photographed. D After the experiments, all the tumors were weighted. These data are expressed as mean ± SD, ***P < 0.001 and ****P < 0.0001 by one-way ANOVA. E Tumor samples were collected, and protein was extracted for western blot analysis. p-STAT3 (Y705), p-STAT3(S727), STAT3, and CMYC were detected, with GAPDH used as the loading control. Immunohistochemistry examinations were performed in the different treatment groups, p-STAT3 (Y705), Ki-67 and cleaved caspase3 were quantified (F) and photographed (G). The scale bar denotes 20 μm. Data are expressed as mean ± SD, **P < 0.01, ****P < 0.0001 and n.s. not significant by one-way ANOVA.

