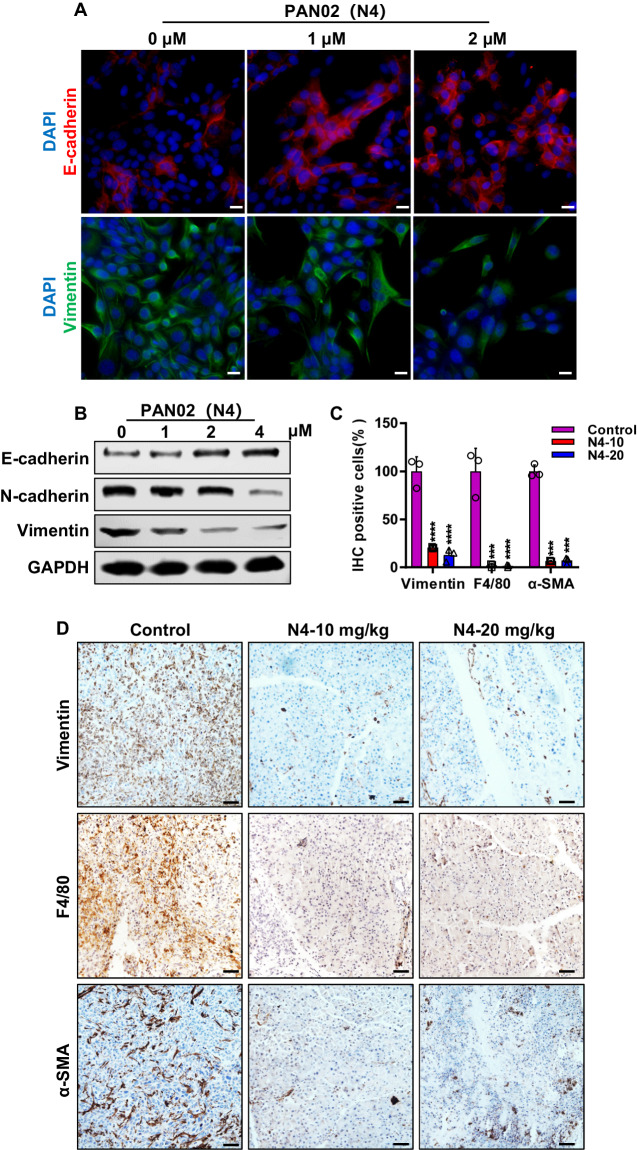
Fig. 8. N4 reverses EMT phenotype and shapes the microenvironment of PDAC.
A IF staining was performed to detected the level of E-cadherin (red) and vimentin (green) after PAN02 treatment with the indicated concentrations of N4 for 24 h. DAPI (blue) was used to stain Nuclei. Scale bar, 20 μm. B Western blot assays were used to examine the expression of E-cadherin, N-cadherin and vimentin after PAN02 treatment with N4 for 24 h. C IHC of vimentin, F4/80 and α-SMA in tumor tissue from orthotopic models. Data represents the mean ± SD; *P < 0.05, **P < 0.01, ***P < 0.001, ****P < 0.0001, n.s. not significant by one-way ANOVA followed by multiple-comparison tests. D Quantification of vimentin, F4/80 and α-SMA in pancreatic tumors from PDAC. Scale bar, 50 μm.

