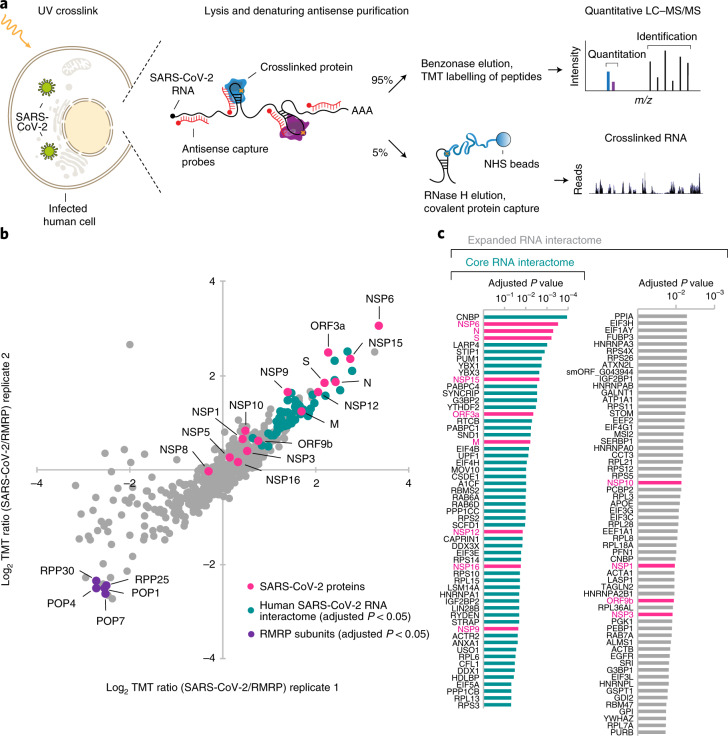
Fig. 1. RNA–protein interactome of SARS-CoV-2 in infected human cells.
a, Outline of the RAP–MS method to identify proteins bound to SARS-CoV-2 RNA and their crosslinked RNA sequences. b, Quantification of SARS-CoV-2 RNA-interacting proteins relative to RMRP-interacting proteins. The scatter plot of log2-transformed TMT ratios from two biological replicates is shown. The grey dots represent all proteins detected with two or more unique peptides. c, Proteins enriched in SARS-CoV-2 RNA purifications (Supplementary Table 1). Left: core SARS-CoV-2 RNA interactome (adjusted P < 0.05). Left and right: expanded SARS-CoV-2 RNA interactome. Significantly enriched proteins are highlighted in teal; SARS-CoV-2-encoded proteins are highlighted in magenta. Adjusted P value: two-tailed moderated t-test.

