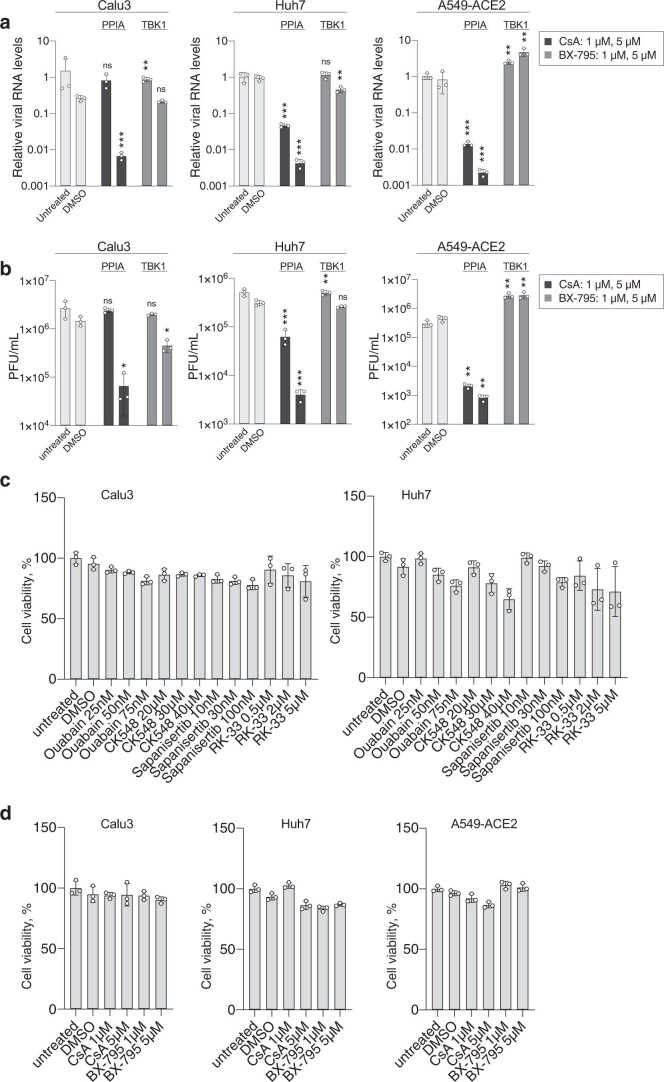
Extended Data Fig. 5. Pharmacological inhibition of SARS-CoV-2 RNA interactome proteins.
a, RT-qPCR measurements of intracellular SARS-CoV-2 RNA (RdRP gene) in infected Calu3, Huh7 and A549-ACE2 cells after inhibitor treatment. Inhibitors were used at indicated concentration (left to right). Calu3 cells were assayed 24 h post-infection, Huh7 and A549-ACE2 cells were assayed 48 h post-infection. Values are normalized to 18S rRNA measurements and compared to untreated or DMSO treated cells. b, Infectious viral titers in the supernatants of infected Calu3, Huh7 and A549-ACE2 cells after inhibitor treatment. Inhibitors were used at indicated concentration (left to right). Calu3 cells were assayed 24 h post-infection, Huh7 and A549-ACE2 cells were assayed 48 h post-infection. All values in a-b are mean ± s.d. (n = 3 independent infections) c-d, Cell viability assay in inhibitor-treated and untreated cells. Values are the mean ± s.d. (n = 3 independent treatments). P values determined in unpaired two-tailed t-test. ***P < 0.001; **P < 0.01; *P < 0.05; ns, not significant.

