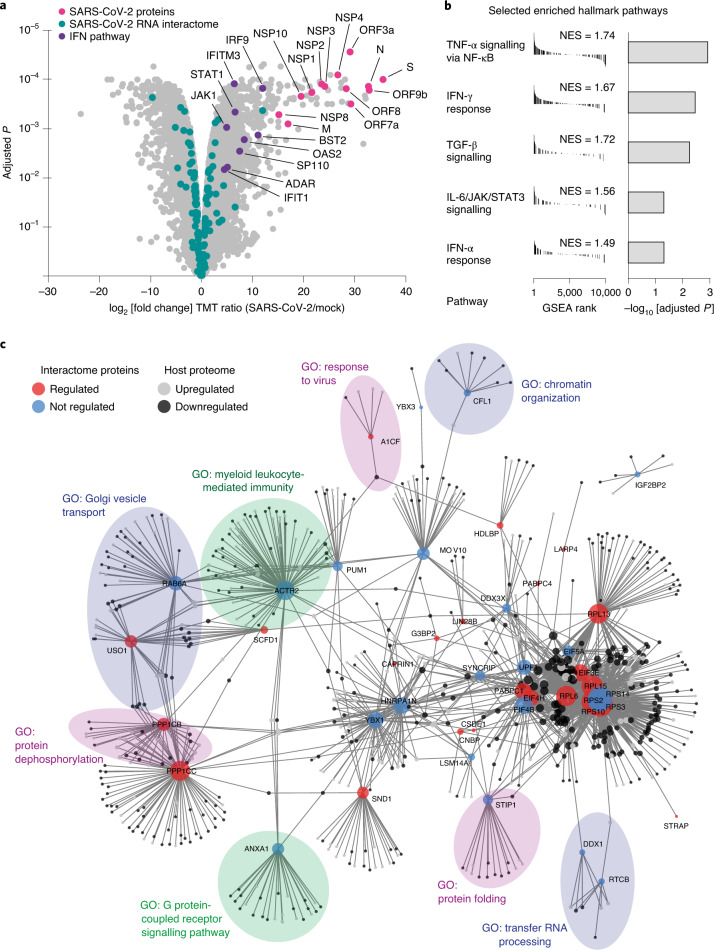
Fig. 3. Connecting the SARS-CoV-2 RNA interactome to perturbations in host cells.
a, Volcano plot of proteome abundance measurements in SARS-CoV-2-infected and uninfected Huh7 cells 24 h post-infection (n = 3) (Supplementary Table 5). Adjusted P value: two-tailed moderated t-test. SARS-CoV-2-encoded proteins are shown in magenta; human SARS-CoV-2 RNA interactome proteins are shown in teal; interferon response-related proteins are shown in purple. b, GSEA for the global proteome abundance measurements shown in a. Selected gene sets are shown; the full table displaying additional enriched gene sets is provided in Extended Data Fig. 3c. Statistical test: Kolmogorov–Smirnov test with Benjamini–Hochberg adjustment. NES, normalized enrichment score. c, Protein–protein association network of core SARS-CoV-2 RNA interactome proteins and their connections to differentially regulated proteins in SARS-CoV-2-infected cells based on curated interactions in STRING v.11 (ref. 96). Upregulated proteins are shown in light grey; downregulated proteins are shown in dark grey. Circle sizes scale to the number of connections of each interactome protein. Selected GO enrichments for network communities are shown in the transparent circles (Methods). Full GO term analysis is provided in Supplementary Table 8.

