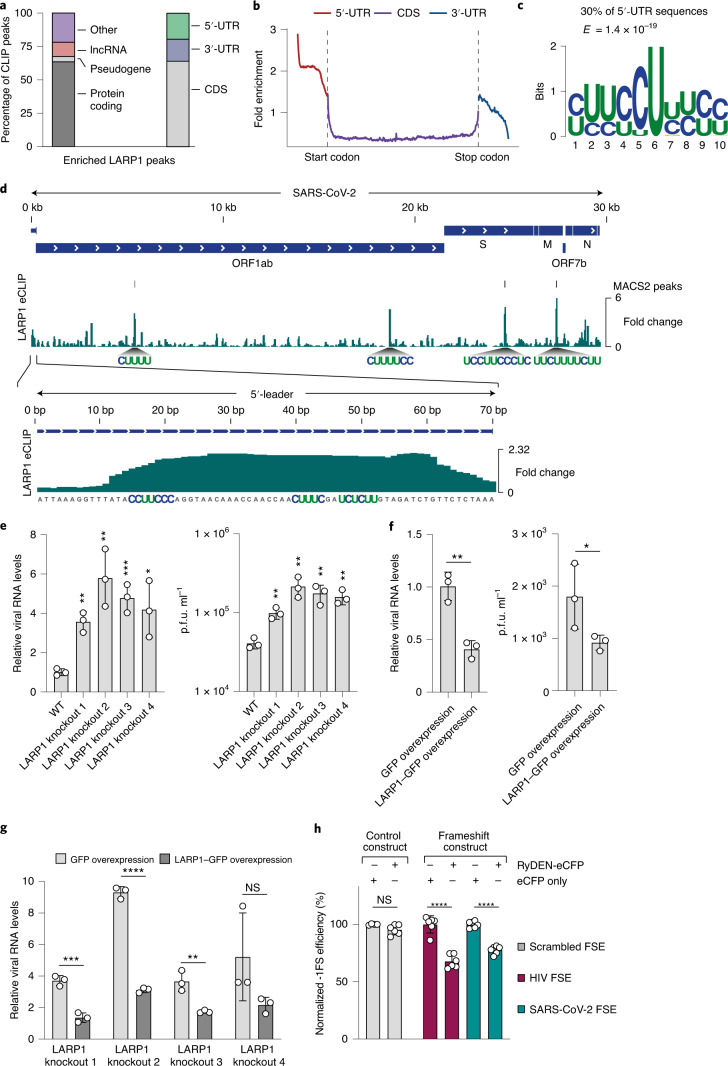
Fig. 5. LARP1 binds SARS-CoV-2 RNAs and restricts viral replication.
a, Distribution of LARP1 eCLIP peaks to different RNA types and transcript regions. b, Meta-gene analysis of LARP1 eCLIP signal across mature mRNAs. c, Oligopyrimidine-rich sequence motif discovered de novo in LARP1 peaks mapping to 5′-UTRs (Methods). d, LARP1 eCLIP data aligned to the SARS-CoV-2 RNA genome. The fold change relative to the size-matched input is shown. MACS2-enriched peaks are shown above the fold change track. Oligopyrimidine-rich sequences that coincide with strongly enriched LARP1 peaks are highlighted. A zoom-in to the SARS-CoV-2 5′-leader sequence is shown below the genomic alignment. e, Left: RT–qPCR measurements of intracellular SARS-CoV-2 RNA at 24 h post-infection in WT HEK293 cells or 4 different LARP1 knockout cell lines. Quantification relative to 18S rRNA and WT cells is shown. Right: Infectious viral titres in the supernatants of infected cells quantified by plaque assays at 24 h post-infection. P values were determined using an unpaired two-tailed t-test. f, Left: RT–qPCR measurements of intracellular SARS-CoV-2 RNA at 24 h post-infection in HEK293 cells transiently overexpressing GFP or LARP1–GFP proteins. Quantification relative to 18S rRNA and GFP-overexpressing cells is shown. Right: Infectious viral titres in the supernatants of infected cells quantified by plaque assays at 24 h post-infection. P values were determined using an unpaired one-tailed t-test. g, RT–qPCR measurements of intracellular SARS-CoV-2 RNA at 24 h post-infection in LARP1 knockout cells complemented with either GFP or LARP1–GFP plasmids. Quantification relative to 18S rRNA and GFP-transfected WT cells is shown. P values were determined using an unpaired two-tailed t-test. e–g, All values are the mean ± s.d. (n = 3 independent infections) h, Quantification of ribosomal frameshifting efficiency using a dual-fluorescence translation reporter (Extended Data Fig. 4d) in HEK293 cells is shown. Data were normalized to cells transfected with eCFP (n = 6 independent transfections, except for control RNA n = 4). Values are the mean ± s.d. ****P < 0.0001, ***P < 0.001, **P < 0.01, *P < 0.05; NS, not significant; FSE, frameshift element.

