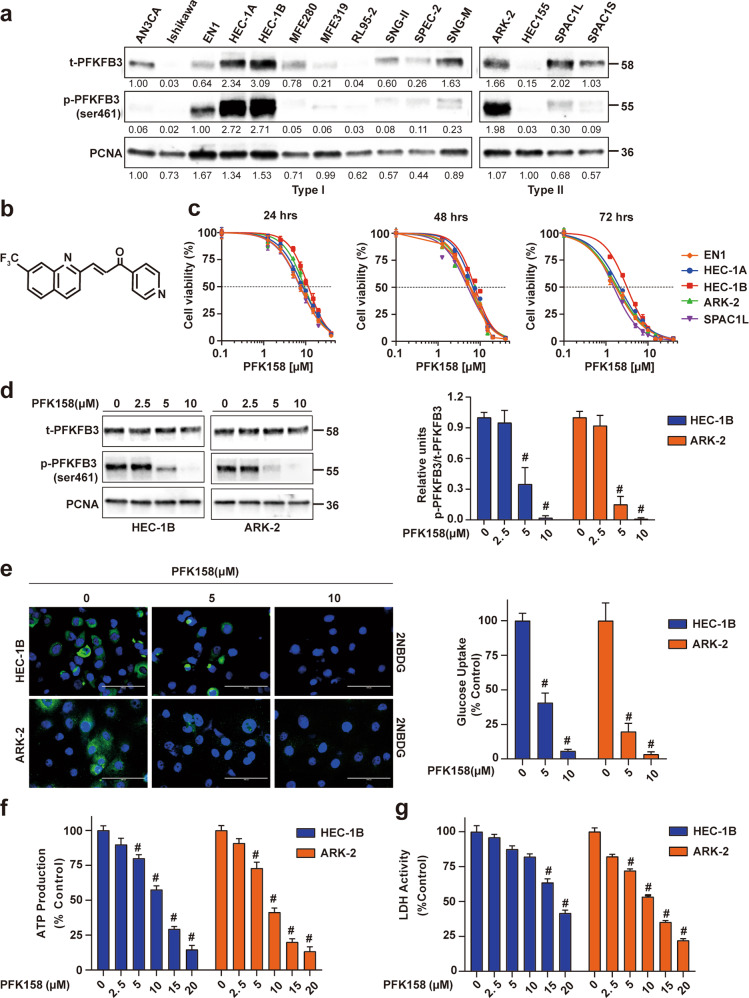
Fig. 1. Pharmacological PFKFB3 inhibition shows obvious cytotoxicity and reduces aerobic glycolysis in vitro.
a The expression levels of total (t)-PFKFB3 and phosphor (p)-PFKFB3 (ser461) in type I and type II EC cell lines were assessed by immunoblot analysis. b Chemical structure of PFK158, a PFKFB3 inhibitor. c EC cells (EN1, HEC-1A, HEC-1B, ARK-2, SPAC1L) were exposed to the indicated concentrations of PFK158 for 24, 48, or 72 h. Cell viability was analyzed by MTT assays and data are presented as mean ± SD. A minimum of three independent experiments were performed. d Expression of (t)-PFKFB3 and phosphor (p)-PFKFB3 (ser461) in HEC-1B and ARK-2 cells after PFK158 (0, 2.5, 5, 10 μM) treatment for 24 h were determined by immunoblotting (left panel). Band intensities were quantified and are presented as bar graphs (right panel). (n = 3; # vs control, #p < 0.0001). e Fluorescence images of glucose uptake using 2-NBDG in HEC-1B and ARK-2 cells. Scale bar, 100 μm. Intracellular ATP generation (f) and LDH activity (g) were measured in HEC-1B and ARK-2 cells in the presence and absence of PFK158. All experiments were repeated at least three times. Data are shown as mean ± SD (n = 3; **p < 0.01, #p < 0.0001).

