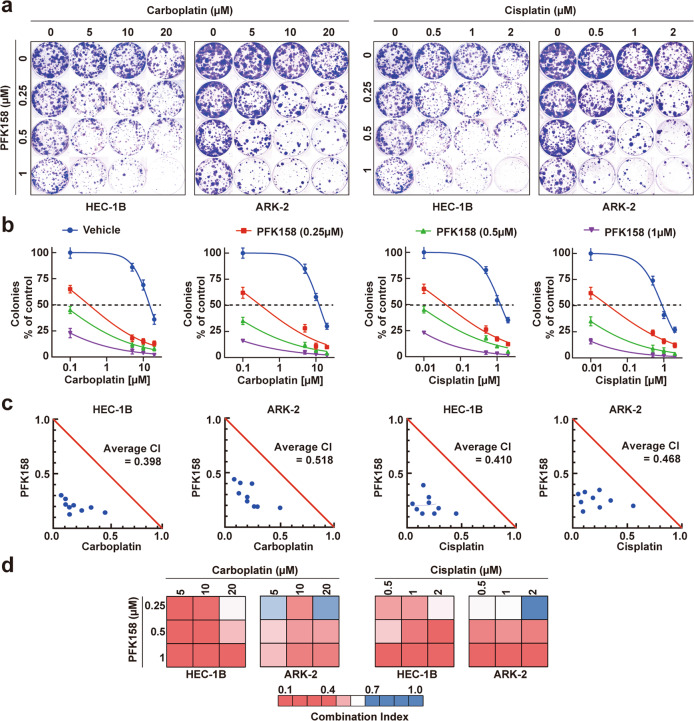
Fig. 2. PFKFB3 inhibition shows synergistic activity with chemotherapeutic agents to inhibit cell proliferation in EC cells.
a, b HEC-1B and ARK-2 cells were incubated with PFK158, CBPt/Cis at a range of concentrations, both individually and in combination for 72 h, and cell viability was measured by clonogenic assays. The synergistic inhibitory effect of PFK158 and CBPt/Cis combination is shown in HEC-1B and ARK-2 cells. All experiments were performed in triplicate. Representative images of plates are shown. c, d Normalized isobologram (obtained with Calcusyn software) over a range of PFK158 and CBPt or Cis dosage combinations. The combination index (CI) was plotted as a function of dose combination, with average CIs for the drug combination reported in the panel. The additive isobole is depicted in this panel as a red straight line, with synergistic dose combinations labeled below the isobole. An average CI of 1 indicates an additive effect, CI < 1 a synergistic effect, and CI > 1 an antagonistic effect.

