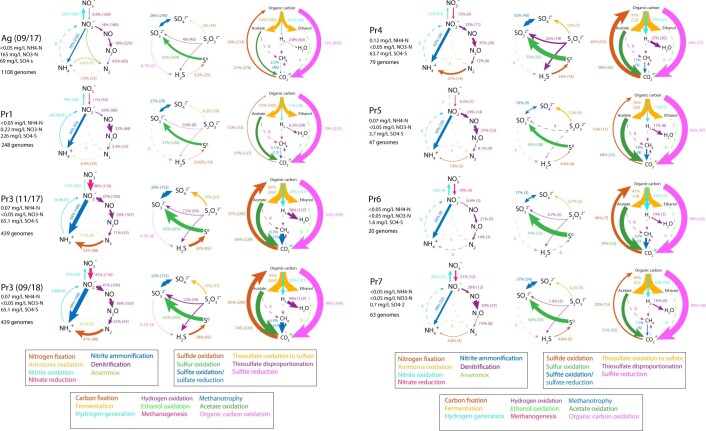
Extended Data Fig. 4. Community-level cycling of nitrogen, sulfur, and carbon in the eight groundwater communities sampled in this study.
Listed next to each metabolic step are the total relative abundance of all genomes capable of carrying out the step, and the number of genomes containing the capacity for that step. Arrow sizes are drawn proportional to the total relative abundance of genomes capable of carrying out the metabolic step.

