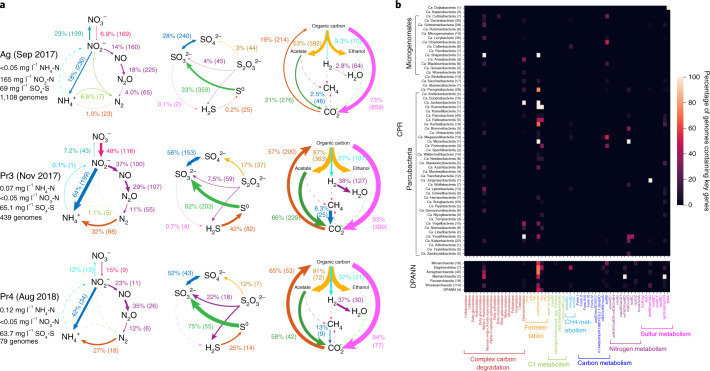
Fig. 3. Metabolic profile of groundwater communities.
a, Biogeochemical cycling diagrams profiling the community-level metabolic potential of three groundwater sites sampled in this study (all of the sites are shown in Extended Data Fig. 4). The total relative abundance of all genomes capable of carrying out the step, as well as the number of genomes containing the capacity for that step, are listed next to each metabolic step. Arrow sizes are drawn proportional to the total relative abundance of genomes capable of carrying out the metabolic step. b, Heat map of 746 CPR and DPANN genomes from this study (rows are phylum-level lineages, and the numbers in parentheses are the number of genomes recovered), showing the percentage of genomes containing key genes required for various metabolic and biosynthetic functions (columns).

