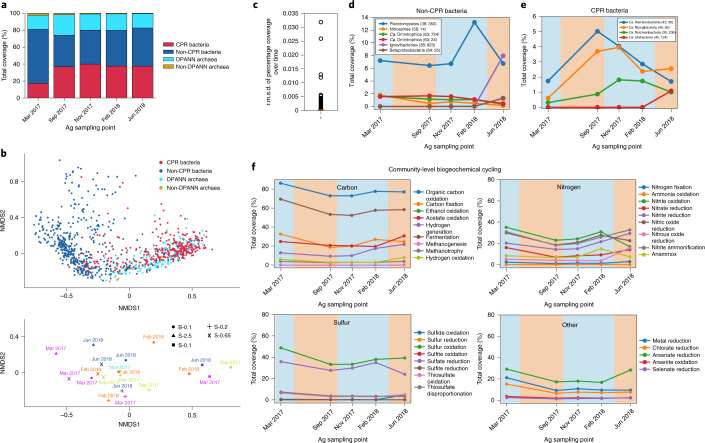
Fig. 4. Ag groundwater microbial community over time.
a, Relative abundances of non-CPR bacteria, CPR bacteria, DPANN archaea and non-DPANN archaea genomes (1,103 in total) in Ag over time. b, NMDS analysis of 1,103 Ag genome relative abundances in all size fractions over all time points. The positions of genomes in ordination space are shown in the top graph, while the positions of the samples in ordination space are shown in the bottom graph. In the bottom graph, B-0.1 refers to bulk filtration on a 0.1 µm filter (circles), S-2.5 refers to 2.5+ µm size fractions (triangles), S-0.65 refers to 0.65–2.5 µm size fractions (crosses), S-0.2 refers to 0.2–0.65 µm size fractions (plus signs), and S-0.1 refers to 0.1–0.2 µm size fractions (closed squares). c, Box plot showing the r.m.s.d. of the relative abundance of all of the genomes in the bulk filter (whole community on a 0.1 µm filter) over time. The median r.m.s.d. (orange line) is <0.001, indicating that there is little variation in relative abundance over time for individual genomes in Ag. d,e, The relative abundance over time for non-CPR bacteria (d) and CPR bacteria (e) that have an r.m.s.d. > 0.004. Genomes are identified in the legend by phylum, percentage GC and coverage in the original time point that the representative genome was derived from (the latter two in parentheses). f, The variation in Ag community-level capacity (total relative abundance of all genomes capable of a broad metabolic function) for carbon, nitrogen, sulfur and miscellaneous element cycling over time. For d–f, the blue and orange backgrounds indicate the rainy and dry seasons in Northern California, respectively.

