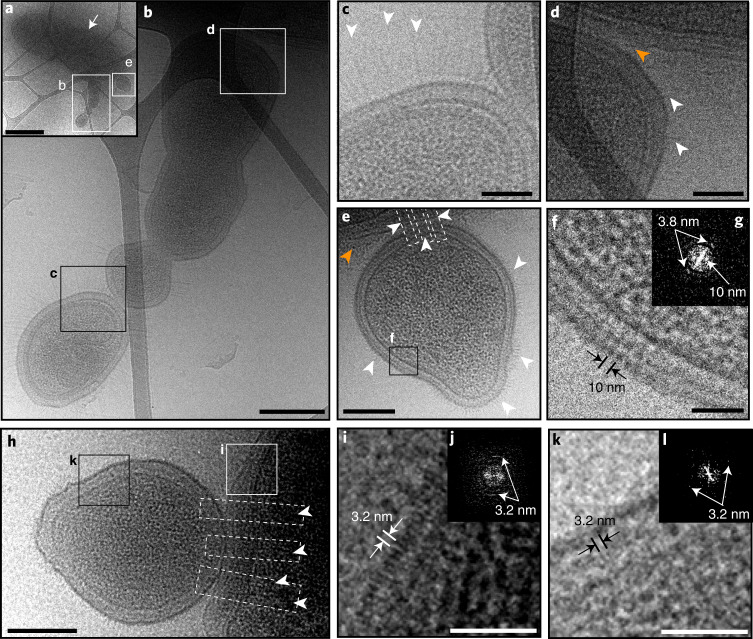
Fig. 5. Imaging of Ag groundwater cells concentrated with tangential flow filtration.
a, Image of larger host cell (white arrow) with multiple ultrasmall cells (magnified in b and e) attached. b, Magnification of the indicated area in a (white box) showing a chain of ultrasmall cells attached to the surface of the larger host cell. c, Magnification of the indicated area in b (black box) showing the contact region between two ultrasmall cells and the pili-like appendages decorating their surfaces (white arrowheads). d, Magnification of the indicated area in b (white box) showing the contact region between an ultrasmall cell and host cell. Pili-like appendages are indicated by white arrowheads. e, Magnification of the indicated area in a (white box) showing a single ultrasmall cell decorated by pili-like appendages (white arrowheads) attached to a host cell. Attachment may be mediated by pili-like appendages that extend from the ultrasmall cell into the host cell (dashed white boxes). f,g, The membrane from the ultrasmall cell in e (black box), with the membrane structure showing a clear periodicity measured to be 10 nm (f) as well as a periodicity of 3.8 nm that is evident in Fourier space (g; white arrows indicate repeating structure spacings). h, Image of a host cell with a single ultrasmall cell attached. Several pili-like appendages extend from the ultrasmall cell into the host cell (dashed white boxes and arrowheads). i,j, Magnification of the indicated area in h (white box) showing the host cell envelope, the outer layer of which exhibits a periodicity of 3.2 nm; a Fourier-transformed image is shown (j; white arrows indicate repeating structure spacings). k,l, Magnification of the indicated area in h (black box) showing the ultrasmall cell envelope, which also exhibits a periodicity of 3.2 nm in the outer layer; a Fourier-transformed image is shown (l; white arrows indicate repeating structure spacings). For d and e, the orange arrowheads indicate lines of high density observed at the contact interface. Scale bars, 1 μm (a), 200 nm (b, e and h) and 50 nm (c, d, f, i and k).

