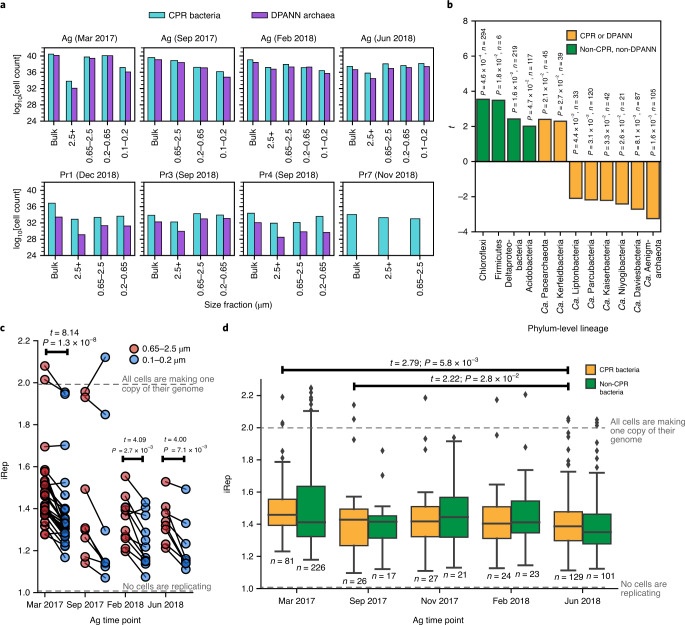
Fig. 6. Analysis of host attachment and growth rates of CPR/DPANN organisms.
a, Estimated cell counts (log transformed) for all size fraction data collected in this study. Each size fraction shown corresponds to a single sampling event. It was logistically infeasible to perform size filtration at some sites, and some filters collected did not contain enough biomass for DNA sequencing. b, Results from a two-sided paired t-test on estimated cell counts of genomes in the largest (2.5+ µm) and smallest (0.1–0.2 µm) size fractions after serial size filtration of Ag groundwater. A positive t statistic indicates enrichment of cells in the 2.5+ µm compared with the 0.1–0.2 µm fraction. Values listed above each bar are the calculated P value and sample size (n, number of genomes tested) for each phylum-level lineage. c, Calculated iRep values for CPR bacteria genomes in the 0.65–2.5 µm fraction versus the 0.1–0.2 µm fraction, across all Ag sampling points. n = 28 (March 2017), n = 8 (September 2017), n = 11 (February 2018) and n = 8 (June 2018) genomes tested. Note that iRep values represent the average replication state of the cell population represented by a genome. An iRep value of 1.0 indicates that, on average, no cells in the population are actively replicating, whereas an iRep value of 2.0 indicates that, on average, every cell is actively creating one copy of its genome. The statistically significant results (P < 0.05) of a two-sided paired t-test on iRep values between the two size fractions are shown above the box plots. Note that the November 2017 time point was excluded because only bulk filtration (no size filtration) was performed. d, Calculated iRep values for Ag bacteria caught in the bulk 0.1 µm filter (whole-community filtration). The statistically significant results (P < 0.05) of independent two-sided t-tests on iRep values of CPR bacteria between all possible pairs of sampling points are shown above the box plots. For the box plot, the centre line is the median; the top and bottom lines are the first and third quartiles, respectively; and the whiskers show 1.5× the interquartile range; individual dots are outliers; n values (number of genomes tested) are indicated on the plot.

