Figure 5.
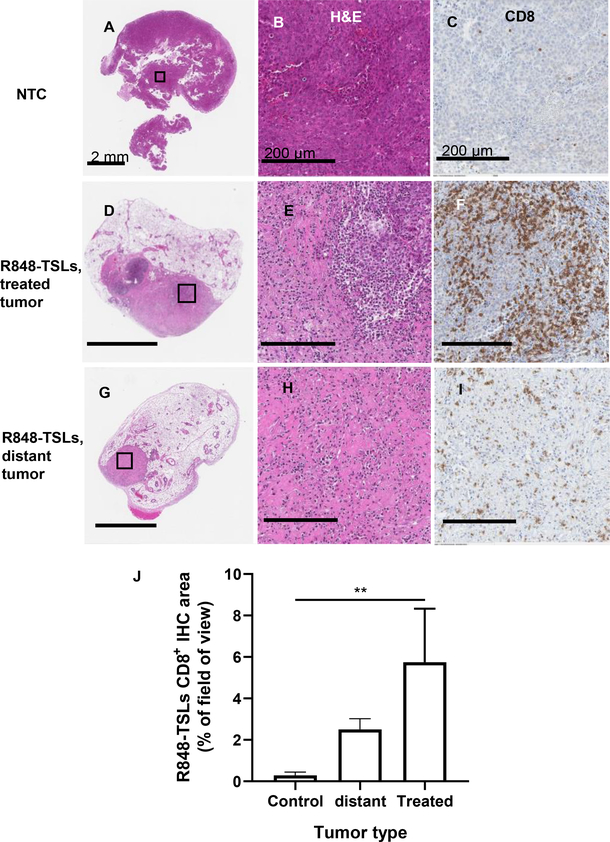
For the treatment plan depicted in Fig. 4A, typical histology images of non-treatment-control (A-C), R848-TSL treated (D-F) and distant (G-I), tumors. H&E images with lower (A, D, G) and higher (B, E, H) magnifications. CD8 antibody-stained images (C, F, I) and CD8 area quantification in tumors (J). Mice received 4 injections of R848-TSLs and 3 injections of αPD-1 in total. The scale bars on the lower magnification images are 2 mm, and the scale bars on the higher magnification images are 200 μm. **, p < 0.01.

