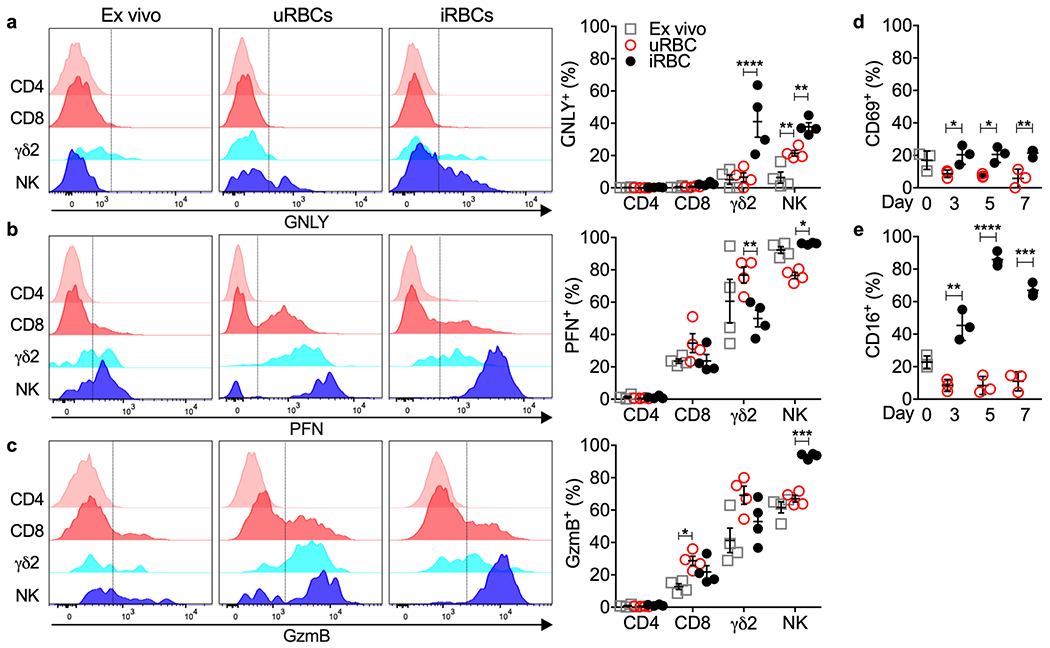
Figure 2. iRBCs activate γδ2 T cells.

a-c, PBMC from HD were evaluated ex vivo (day 0) and after co-culture with uRBCs or iRBCs for 7 days. Shown are representative flow cytometry histograms (left) and percent positive cells for 4 HD samples (right) after staining for cell surface CD3+CD4+ (CD4), CD3+CD8+ (CD8), CD3+TCRδ2+ (γδ2), CD3−CD56+ (NK) and intracellular GNLY (a), PFN (b) or GzmB (c). The vertical gating lines were drawn based on the unstained sample. d,e, γδ2 T cell activation before and during co-culture with uRBCs or iRBCs was evaluated by CD69 and CD16 staining, n=3 independent donor samples. Statistical analysis was performed by two-way ANOVA with Sidak’s multiple comparisons test (a-c) and two-way ANOVA with Tukey’s multiple comparisons test (d-e). Mean ± s.e.m. is shown. P value: *<0.05, **<0.01,***<0.001, ****<0.0001. Data shown are representative of three independent experiments.
